Why does SSL client report google’s certificate “self-signed”?

In previous post, I implemented a simple HTTPS client, but the program has a small flaw, i.e., when connecting to “www.google.com:443“, it will report following error in verifying certificate:

error code is 18:self signed certificate

error code is from SSL_get_verify_result:

long SSL_get_verify_result(const SSL *ssl)
{
    return ssl->verify_result;
}

and 18 is mapping to X509_V_ERR_DEPTH_ZERO_SELF_SIGNED_CERT, which means “self-signed certificate”. But for other websites, e.g., facebook.com, no error is outputted.

Use OpenSSL‘s client-arg program to test:

# LD_LIBRARY_PATH=/root/openssl/build gdb --args ./client-arg -connect "www.google.com:443"
......
Thread 2 hit Breakpoint 1, main (argc=3, argv=0xfffffc7fffdf4c38) at client-arg.c:99
99      BIO_puts(sbio, "GET / HTTP/1.0\n\n");
(gdb) p ssl->verify_result
$1 = 18
(gdb)

The same error code: 18. But openssl-s_client can guarantee the certificate is not “self-signed”:

# LD_LIBRARY_PATH=/root/openssl/build openssl s_client -connect google.com:443
CONNECTED(00000004)
depth=2 OU = GlobalSign Root CA - R2, O = GlobalSign, CN = GlobalSign
verify return:1
depth=1 C = US, O = Google Trust Services, CN = GTS CA 1O1
verify return:1
depth=0 C = US, ST = California, L = Mountain View, O = Google LLC, CN = *.google.com
verify return:1
---
Certificate chain
 0 s:C = US, ST = California, L = Mountain View, O = Google LLC, CN = *.google.com
   i:C = US, O = Google Trust Services, CN = GTS CA 1O1
 1 s:C = US, O = Google Trust Services, CN = GTS CA 1O1
   i:OU = GlobalSign Root CA - R2, O = GlobalSign, CN = GlobalSign
---
......

Hmm, I need to find the root cause.

First of all, I searched the code to see when X509_V_ERR_DEPTH_ZERO_SELF_SIGNED_CERT is set, and found only one spot:

if (self_signed)
            return verify_cb_cert(ctx, NULL, num - 1,
                                  sk_X509_num(ctx->chain) == 1
                                  ? X509_V_ERR_DEPTH_ZERO_SELF_SIGNED_CERT
                                  : X509_V_ERR_SELF_SIGNED_CERT_IN_CHAIN);

The interesting thing is the amount of certificates in the chain is only 1, but from above openssl-s_client‘s output, there are 2 certificates in the chain. OK, let’s see the content of this “self-signed” certificate.

After some debugging, I finally found tls_process_server_certificate, which is used to process the server’s certificate. With the help of gdb, I can dump the content of certificate:

# gdb --args ./client www.google.com:443
.......
(gdb) b tls_process_server_certificate
......
Thread 2 hit Breakpoint 1, tls_process_server_certificate (s=0xf09e90, pkt=0xfffffc7fffdefe30)
    at ../ssl/statem/statem_clnt.c:1768
1768        X509 *x = NULL;
......
1806            if (certbytes != (certstart + cert_len)) {
(gdb)
1811            if (SSL_IS_TLS13(s)) {
(gdb) dump binary memory cert certstart certstart + cert_len
......

Try to check the cert file:

# cat cert
......
�0� *�H��       (No SNI provided; please fix your client.10Uinvalid2.invalid0�"0
��bO����
.....

The reason is obvious: “No SNI provided; please fix your client.”. Ah, I need to set SNI explicitly. After invoking SSL_set_tlsext_host_name, the certificate chain becomes correct (The new code can be downloaded here).

Summary: I am not an SSL/TLS expert, and OpenSSL project is complex and daunting. But with some basic SSL/TLS knowledge and the help of debugger, I can find the root cause of issues independently. Don’t give up, digest code bit by bit, finally you will win!
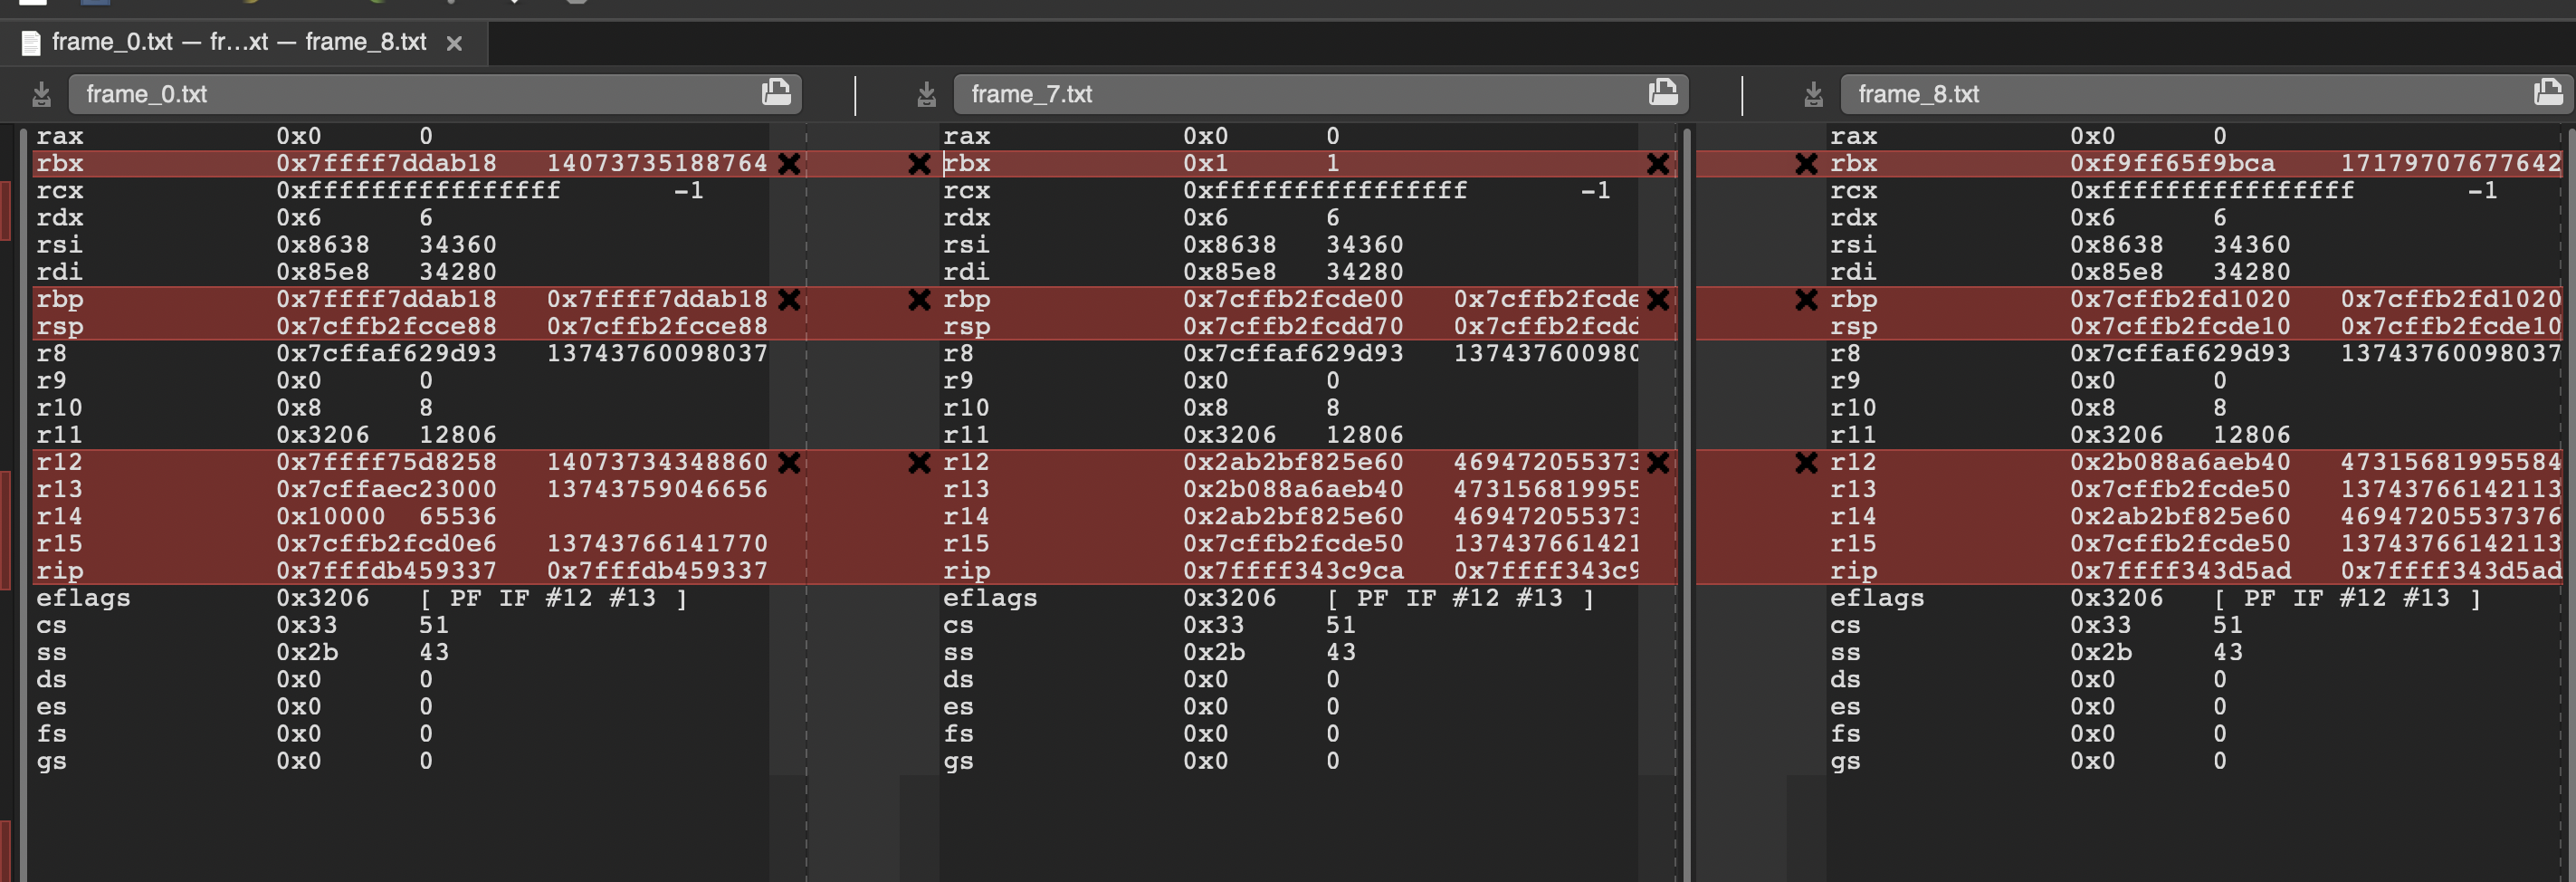
The registers’ values in core dump file on x86_64

On x86_64 platforms, some registers are “caller-saved” whilst others are “callee-saved” (refer AMD64 Calling Conventions for Linux / Mac OSX), or from Optimizing subroutines in assembly language, section 4.1, Register usage, “Registers that
can be used freely” (“caller-saved”) and “Registers that must be saved and restored” (“callee-saved”). When using gdb to display registers values, the values are relative to the selected stack frame (Refer Registers):

Normally, register values are relative to the selected stack frame (see Selecting a Frame). This means that you get the value that the register would contain if all stack frames farther in were exited and their saved registers restored. In order to see the true contents of hardware registers, you must select the innermost frame (with ‘frame 0’).

……

Also, the more “outer” the frame is you’re looking at, the more likely a call-clobbered register’s value is to be wrong, in the sense that it doesn’t actually represent the value the register had just before the call.

So it means when using gdb to analyse core dump file, you must pay attention to the registers values since it may not reflect correct values of current stack frame. Check following diagram:

You can see only RSPRIP and “callee-saved” registers are different among frame 07 and 8.

Build gdb on illumos

Claim: Since illumos provides its own debugger: mdb, I don’t want to convince anybody to use gdb instead of mdb. Compile and use gdb is just my personal hobby.

I use OmniOS, and I think this material should also apply to other illumos OSs and even Solaris:

(1) Download and extract gdb source code (currently the newest versin is 8.3);
(2) Enter the gdb directory and do configuration:

# cd gdb-8.3
# mkdir build
# ../configure CC='gcc -m64'  CXX='g++ -m64'

(3) Build it:

# gmake

After compiling, testing it:

# ./gdb-8.3/build/gdb/gdb --data-directory=./gdb-8.3/build/gdb/data-directory/ -q a.out
Reading symbols from a.out...
(gdb) start
Temporary breakpoint 1 at 0x4011b6: file test.c, line 4.
Starting program: /root/a.out
[Thread debugging using libthread_db enabled]
[New Thread 1 (LWP 1)]
[Switching to Thread 1 (LWP 1)]

Thread 2 hit Temporary breakpoint 1, main () at test.c:4
4               printf("%d\n", sizeof(long unsigned int));
(gdb) n
8
5               return 0;
(gdb)
6       }
(gdb)

So far so good!

Postmortem of NTL::Vec type

I am playing with NTL, and come across a core dump issue which is related with NTL::ZZX variable:

(gdb) p msg
$2 = (NTL::ZZX &) @0x7fff680601f0: {rep = {_vec(long double,...)( *) = {rep = 0xab629d0}}}

The NTL::ZZX actually contains one member, rep:

class ZZX {

public:

vec_ZZ rep;

......

ZZ& operator[](long i) { return rep[i]; }
const ZZ& operator[](long i) const { return rep[i]; }

......
}

The vec_ZZ is a vector (not std::vector, NTL::Vec instead) in fact:

typedef Vec<ZZ> vec_ZZ;

The error occurs when getting the 8191-st element. Unfortunately, I can’t use gdb to access the element in vector directly:

(gdb) p i
$3 = 8191
(gdb) p msg[i]
You can't do that without a process to debug.

After referring this doc, it gives me the idea that seems be the gdb‘s limitation of accessing container. So I try to access the member straightaway.NTL::Vec is just a template class containing one public member:

template<class T>
class Vec {  
public:  
    ......
    WrappedPtr<T, _vec_deleter> _vec__rep;
    ......
};

While WrappedPtr is nothing but another template class:

template<class T, class Deleter>
class WrappedPtr {
   ......
public:
   typedef T * raw_ptr;

   raw_ptr rep;
   ......
}

We can see the rep member in WrappedPtr points to the start address of the content in vector. Read the 8191-st element’s value:

(gdb) p sizeof(*msg.rep._vec__rep.rep)
$23 = 8
(gdb) x/16xb msg.rep._vec__rep.rep+8191
0xab729c8:      0x77    0x01    0x00    0x00    0x00    0x00    0x00    0x00
0xab729d0:      0x00    0x00    0x00    0x00    0x00    0x00    0x00    0x00

The valid value should be a memory address, 0x177 is definitely not. So the next thing is to find out why this isn’t correct …

The tips of using and debugging C++ std::iostream

(1) Be cautious of '\n' and std::endl.

The std::endl will flush the output buffer while '\n' not. For example, in socket programming, if client sends message to server using '\n', like this:

out << "Hello World!" << '\n';
out << "I am coming" << '\n';

The server may still block in reading operation and no data is fetched. So you should use std::endl in this case:

out << "Hello World!" << std::endl;
out << "I am coming" << std::endl;

(2) Use std::ios::rdstate.

std::ios::rdstate is a handy function to check the stream state. You can use it in gdb debugging:

(gdb) p in.rdstate()
$45 = std::_S_goodbit
(gdb) n
350             return in;
(gdb) p in.rdstate()
$46 = std::_S_failbit

Through step-mode, we can see which operation crashes the stream.

(3) Serialize the data into file.

No matter you want to do test or debug issue, dump the data into a file and read it back is a very effective method:

std::ofstream ofs("data.txt");
ofs << output;
ofs.close();

std::ifstream ifs("data.txt");
ifs >> input;
ifs.close();

The above simple code can verify whether your serialization functions are correct or not. Trust me, it is a very brilliant trouble-shouting std::iostream issue trick, and it saved me just now!