Use perf and FlameGraph to profile program on Linux

In most Linux environments, the perf tools should be set up by default. Otherwise, you can install it manually. E.g., in ArchLinux:

# pacman -S perf

Use following program as an example (It is a rifacimento from here, and you should only focus on the framework of the code):

# cat test.cpp
#include <NTL/ZZX.h>

using namespace std;
using namespace NTL;

void inner(int i, ZZX& t, Vec<ZZX>& phi)
{
        for (long j = 1; j <= i-1; j++)
         if (i % j == 0)
            t *= phi(j);
}

void outer(int i, Vec<ZZX>& phi)
{
        ZZX t;
        t = 1;
        inner(i, t, phi);
        phi(i) = (ZZX(INIT_MONO, i) - 1)/t;
        cout << phi(i) << "\n";
}

int main()
{
   Vec<ZZX> phi(INIT_SIZE, 100);

   for (long i = 1; i <= phi.length(); i++) {
      outer(i, phi);
   }
}

Compile it:

# g++ -g -O2 -pthread test.cpp -lntl -lgmp

It is suggested that using -g -O2 options since -g can provide debug information which perf needs and -O2 can generate lots of optimizations.

Use perf record to sample the program:

# perf record --call-graph dwarf ./a.out
......
[ perf record: Woken up 2 times to write data ]
[ perf record: Captured and wrote 0.318 MB perf.data (38 samples) ]

To profile an already running program, use -p pid flag. A perf.data file will be generated in current directory, and you can use perf report command to parse it:
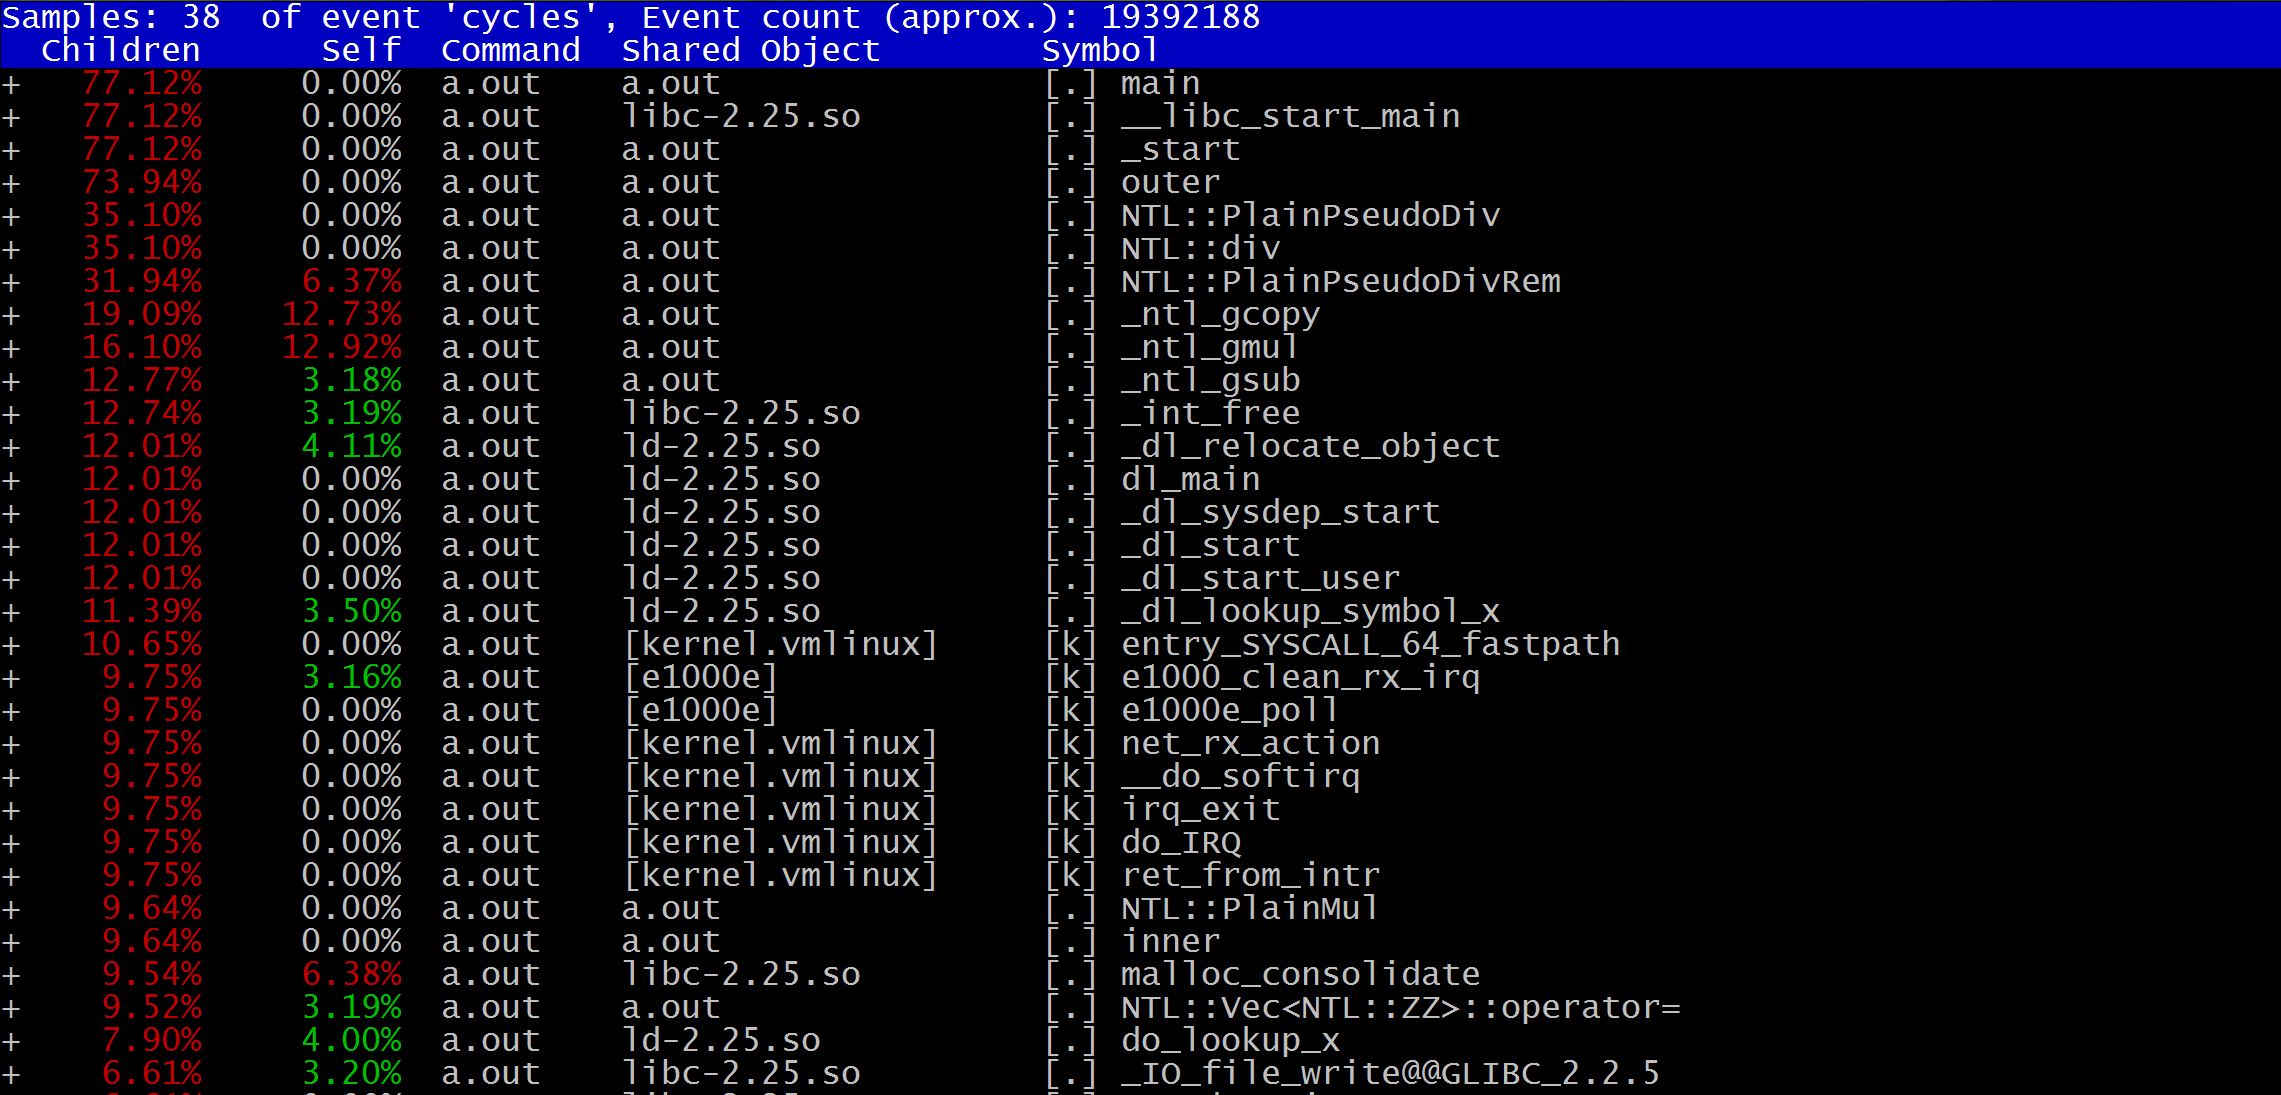
# perf report

The detailed information of every function will be showed:

Capture

Another awesome tool is FlameGraph which is used to analyze stack call traces:

# git clone --depth 1 https://github.com/brendangregg/FlameGraph
# cd FlameGraph

Copy perf.data into current directory:

# cp ../perf.data ./

Execute following command:

# perf script | ./stackcollapse-perf.pl |./flamegraph.pl > perf.svg

The perf.svg is like this:

FlameGraph

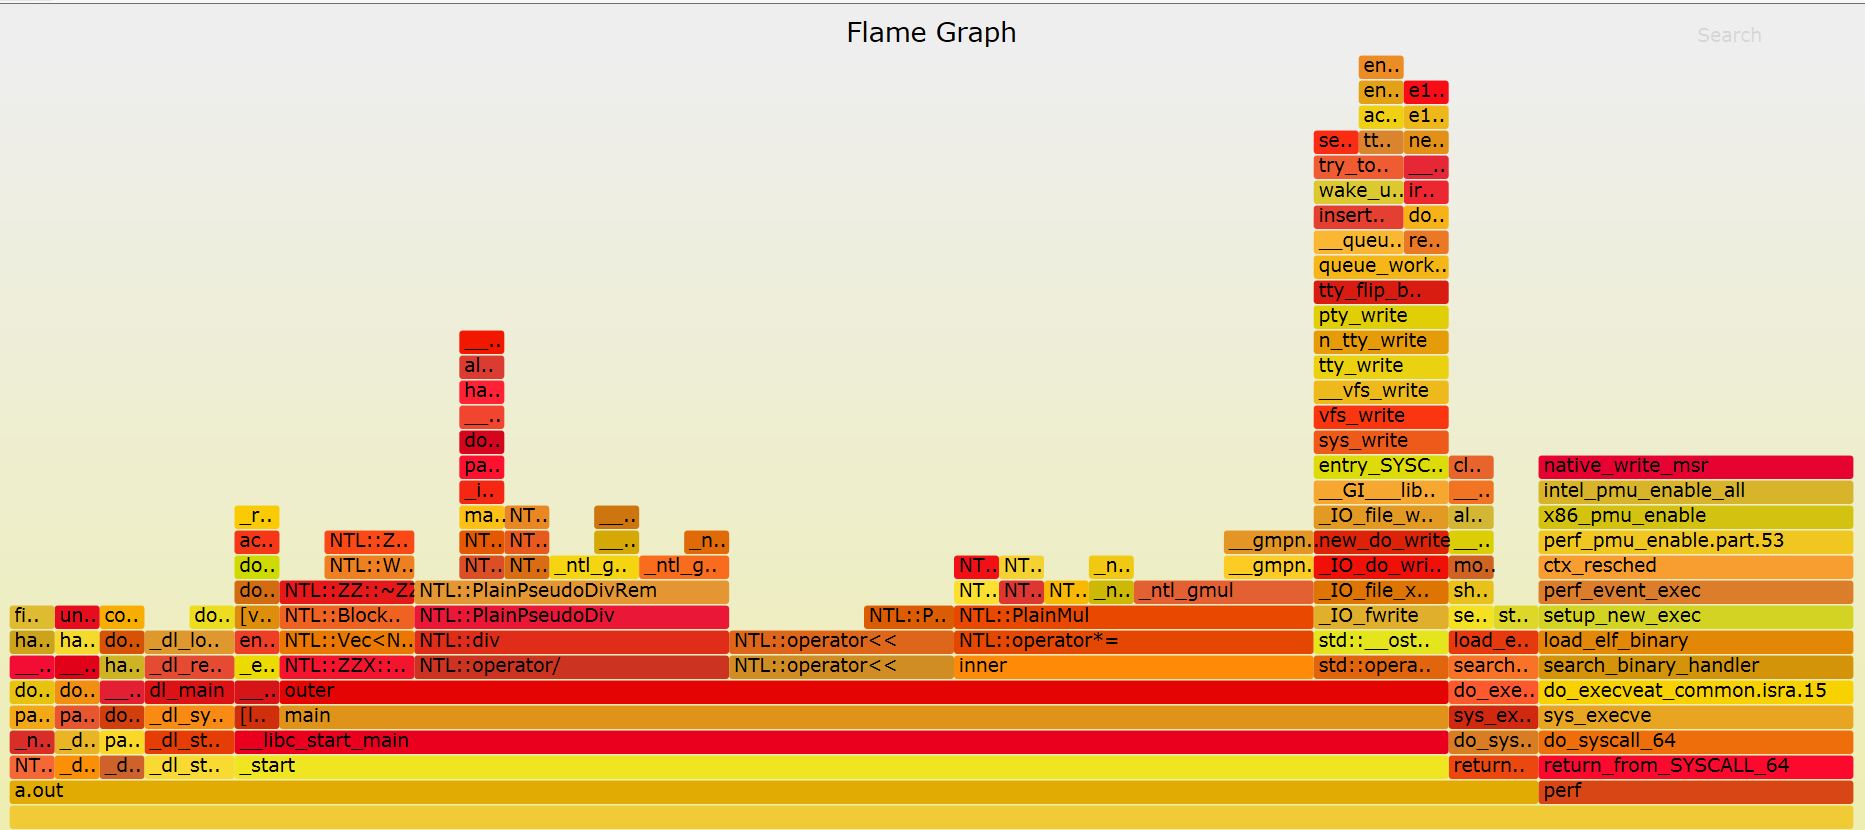
You can see the whole stack frameworks and functions’ consume time ratio.

P.S., the full code isĀ here.

Use “.cu” as file extension name when playing Thrust

Today, I tried the simple Thrust program:

$ cat a.c
#include <thrust/host_vector.h>
#include <thrust/device_vector.h>
#include <iostream>

int main(void) {
        // H has storage for 4 integers
        thrust::host_vector<int> H(4);

        // initialize individual elements
        H[0] = 14;
        H[1] = 20;
        H[2] = 38;
        H[3] = 46;

        // H.size() returns the size of vector H
        std::cout << "H has size " << H.size() << std::endl;

        // print contents of H
        for(int i = 0; i < H.size(); i++)
                std::cout << "H[" << i << "] = " << H[i] << std::endl;

        // resize H
        H.resize(2);
        std::cout << "H now has size " << H.size() << std::endl;

        // Copy host_vector H to device_vector D
        thrust::device_vector<int> D = H;

        // elements of D can be modified
        D[0] = 99;
        D[1] = 88;

        // print contents of D
        for(int i = 0; i < D.size(); i++)
                std::cout << "D[" << i << "] = " << D[i] << std::endl;

        // H and D are automatically deleted when the function returns
        return 0;
}

Built it:

$ nvcc -arch=sm_37 a.c
In file included from a.c:1:0:
/opt/cuda/bin/..//include/thrust/host_vector.h:25:18: fatal error: memory: No such file or directory
compilation terminated.

It seemed very weird! After scanning Thrust’s FAQ, I came across the following tip:

Make sure that files that #include Thrust have a .cu extension. Other extensions (e.g., .cpp) will cause nvcc to treat the file incorrectly and produce an error message.

Renamed the source file name and rebuilt it:

$ mv a.c a.cu
$ nvcc -arch=sm_37 a.cu
$ ./a.out
H has size 4
H[0] = 14
H[1] = 20
H[2] = 38
H[3] = 46
H now has size 2
D[0] = 99
D[1] = 88

Worked like a charm!