The experience of fixing a memory corruption issue

I came across a program crash last week:

Program terminated with signal 11, Segmentation fault.
#0  0x00007ffff365bd29 in __memcpy_ssse3_back () from /usr/lib64/libc.so.6
#1  0x00007ffff606025c in memcpy (__len=<optimized out>, __src=0x0, __dest=0x0) at /usr/include/bits/string3.h:51
......
#5  0x0000000000000000 in ?? () 

The 5th stack frame address is 0x0000000000000000, and it seems not right. To debug it, get the registers values first:

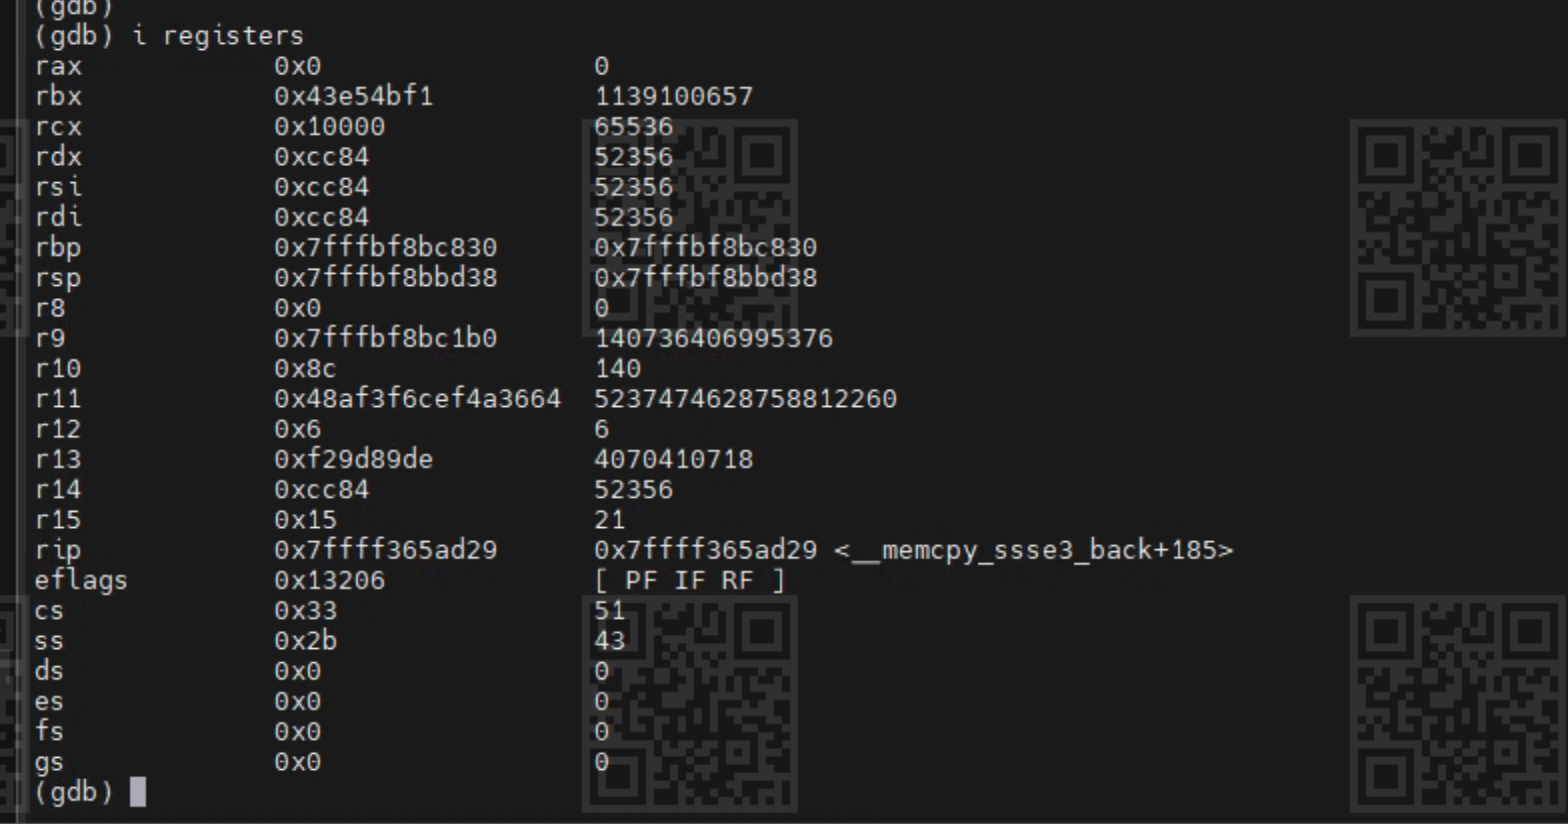
According to X86_64 architecture, The value in memory address (%rbp) should be previous %rbp value, and the value in memory address (%rbp) + 8 should be return address. Checked these two values, and found they are all 0s, so it means the stack is corrupted.

The next thing to do is dump the memory between %rsp and %rbp, and refer the assembly code of the function at the same time. With this, I can know which memory part doesn’t seem correct, and review code accordingly. Finally I found the root cause and fixed it.

P.S., in optimisation build mode, some functions may be inlined, so please be aware of this caveat.

The pitfall of upgrading 3rd-party library

Today, I debugged a tricky issue, a bug related to a 3rd-party library. When I used gdb to check a structure’s values, found the last member was missed compared to the definitions in header file. I began to suspect this might be caused by 3rd-party library. I checked the upgrade log, then found the root cause: when I compiled the code, the 3rd-party library’s version is v1.1, but when I run the program, the library was upgraded to v1.2 by others, which caused this mysterious bug. The solution is simple: rebuild the code. But the debugging process is exhausting.

Bisection assert is a good debug methodology

Recently, I fixed an issue which is related to uninitialised bit-field in C programming language. Because the bit-filed can be either 0 or 1, so the bug will occur randomly. But the good news is the reproduced rate is very high, nearly 50%. Though I am not familiar with the code, I used bisection assert to help:

 {
  ......
  assert(bit-field == 0);
  ......
  assert(bit-field == 0);
  ......
 }

If the first assert is not triggered, but the second one is, I can know which code block has the bug, then bisect code and add assert again, until the root cause is found.

The gotcha of logging gdb output

By default, gdb‘s output file is appended, not overwrote. E.g: debug the same program for 2 times:

$ gdb foo
......
(gdb) set logging on
Copying output to gdb.txt.
Copying debug output to gdb.txt.
(gdb) r
......
$ ll gdb.txt
-rw-rw-r-- 1 nanxiao nanxiao 1067 Jul  9 18:06 gdb.txt
$ gdb foo
......
(gdb) set logging on
Copying output to gdb.txt.
Copying debug output to gdb.txt.
(gdb) r
......
$ ll gdb.txt
-rw-rw-r-- 1 nanxiao nanxiao 2134 Jul  9 18:08 gdb.txt

After second debug, the gdb.txt‘s size is doubled. To overwrite the output file, execute set logging overwrite on before set logging on:

$ gdb foo
......
(gdb) set logging overwrite on
(gdb) set logging on
Copying output to gdb.txt.
Copying debug output to gdb.txt.
(gdb) r
......
$ ll gdb.txt
-rw-rw-r-- 1 nanxiao nanxiao 1067 Jul  9 18:10 gdb.txt

A trick of setting breakpoint in pdb

When using pdb to debug a python program:

python -m pdb foo.py

I want to set a breakpoint, but meet following error:

(Pdb) b bar.py:46
*** 'bar.py' not found from sys.path

A small trick is setting breakpoint in main first and run the program:

(Pdb) b main
Breakpoint 1 at ......
(Pdb) r
......

After breakpoint set for main is hit, set breakpoint again at bar.py:46. This time it should work:

(Pdb) b bar.py:46
Breakpoint 2 at ......