docker笔记(9)—— 通过systemd管理docker

包括RHEL在内的很多Linux操作系统通过systemd管理docker。例如启动和停止docker daemon

# systemctl start docker
# systemctl stop docker

另外,可以使用systemctl status docker检查目前docker daemon的运行状态:

# systemctl status docker
● docker.service - Docker Application Container Engine
   Loaded: loaded (/lib/systemd/system/docker.service; enabled)
  Drop-In: /etc/systemd/system/docker.service.d
           └─http-proxy.conf
   Active: active (running) since Mon 2016-03-28 23:04:48 EDT; 21min ago
     Docs: https://docs.docker.com
 Main PID: 64991 (docker)
   CGroup: /system.slice/docker.service
           └─64991 /usr/bin/docker daemon -D -H fd://

Mar 28 23:08:51 lxc-dl980-g7-1-hLinux docker[64991]: time="2016-03-28T23:08:51.685679667-04:00" level=debug msg="devmapper: Delete...START"
Mar 28 23:08:51 lxc-dl980-g7-1-hLinux docker[64991]: time="2016-03-28T23:08:51.688765554-04:00" level=debug msg="devmapper: issueD...START"
Mar 28 23:08:51 lxc-dl980-g7-1-hLinux docker[64991]: time="2016-03-28T23:08:51.689292872-04:00" level=debug msg="devmapper: activa...c9f6)"
Mar 28 23:08:53 lxc-dl980-g7-1-hLinux docker[64991]: time="2016-03-28T23:08:53.050572512-04:00" level=debug msg="devmapper: issueD.... END"
.....

配置文件是/lib/systemd/system/docker.service,修改这个文件后要记得使用systemctl daemon-reload命令重新加载一下。

systemctl show docker命令显示docker的各种配置信息:

~# systemctl show docker
Type=notify
Restart=no
NotifyAccess=main
RestartUSec=100ms
TimeoutStartUSec=0
TimeoutStopUSec=1min 30s
WatchdogUSec=0
WatchdogTimestampMonotonic=0
StartLimitInterval=10000000
StartLimitBurst=5
StartLimitAction=none
FailureAction=none
PermissionsStartOnly=no
......

关于如何使用journalctl查看log,可以参考https://www.loggly.com/ultimate-guide/using-journalctl/

绑定service和运行的CPUhttps://www.golinuxhub.com/2018/02/how-to-assign-service-to-specific-core/ 。

参考资料:
Control and configure Docker with systemd


Go语言的slice

以下摘自The Go Programming Language

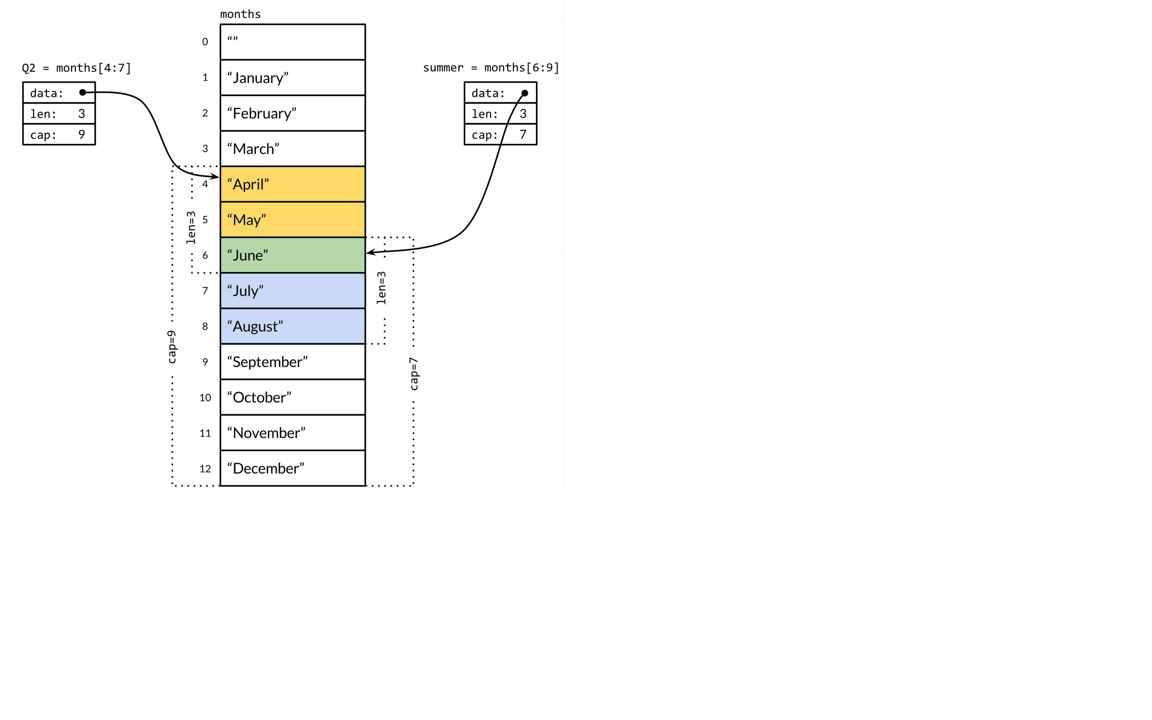
A slice has three components: a pointer, a length, and a capacity. The pointer points to the first element of the array that is reachable through the slice, which is not necessarily the array’s first element. The length is the number of slice elements; it can’t exceed the capacity, which is usually the number of elements between the start of the slice and the end of the underlying array. The built-in functions len and cap return those values.Multiple slices can share the same underlying array and may refer to overlapping parts of that array:


Untitled

The slice operator s[i:j], where 0 ≤ i ≤ j ≤ cap(s), creates a new slice that refers to elements i through j-1 of the sequence s, which may be an array variable, a pointer to an array, or another slice. The resulting slice has j-i elements. If i is omitted, it’s 0, and if j is omitted, it’s len(s).


Since a slice contains a pointer to an element of an array, passing a slice to a function permits the function to modify the underlying array elements. In other words, copying a slice creates an alias for the underlying array.


Unlike arrays, slices are not comparable, so we cannot use == to test whether two slices contain the same elements. The standard library provides the highly optimized bytes.Equal function for comparing two slices of bytes ([]byte), but for other types of slice, we must do the comparison ourselves.


The only legal slice comparison is against nil, as in
if summer == nil { /* … */ }
The zero value of a slice type is nil. A nil slice has no underlying array. The nil slice has length and capacity zero, but there are also non-nil slices of length and capacity zero, such as []int{} or make([]int, 3)[3:]. As with any type that can have nil values, the nil value of a particular slice type can be written using a conversion expression such as []int(nil).

var s []int // len(s) == 0, s == nil

s = nil // len(s) == 0, s == nil

s = []int(nil) // len(s) == 0, s == nil

s = []int{} // len(s) == 0, s != nil

So, if you need to test whether a slice is empty, use len(s) == 0, not s == nil. Other than comparing equal to nil, a nil slice behaves like any other zero-length slice.


/proc/self/mountinfo文件

Linux系统的/proc/self/mountinfo记录当前系统所有挂载文件系统的信息:

# cat /proc/self/mountinfo
17 61 0:16 / /sys rw,nosuid,nodev,noexec,relatime shared:6 - sysfs sysfs rw,seclabel
18 61 0:3 / /proc rw,nosuid,nodev,noexec,relatime shared:5 - proc proc rw
19 61 0:5 / /dev rw,nosuid shared:2 - devtmpfs devtmpfs rw,seclabel,size=6024144k,nr_inodes=1506036,mode=755
......

关于这个文件各个字段的解释,可以参考这里Linux系统df命令的实现也会读取这个文件,比如获得文件系统类型:

# df -h
Filesystem             Size  Used Avail Use% Mounted on
/dev/mapper/rhel-root   50G   44G  6.5G  88% /
devtmpfs               5.8G     0  5.8G   0% /dev
tmpfs                  5.8G   84K  5.8G   1% /dev/shm
......


uptime命令简介

uptime命令用来显示系统已经运行的时间:

# uptime
 19:05:33 up  3:16,  2 users,  load average: 0.00, 0.01, 0.05

19:05:33是当前系统时间,up 3:16是系统已经运行了3小时16分。后面还有用户和系统load信息。如果只关心系统运行了多次时间,可以使用下列命令:

# uptime -p
up 3 hours, 16 minutes

uptime命令得到系统运行时间是通过读取/proc/uptime文件:

# cat /proc/uptime
11984.78 95454.77

第一个字段是系统启动的秒数,第二个字段是系统每个CPU core处在idle状态的时间总和。


什么是swap空间?

这篇文章很好地解释了什么是swap

Swap space in Linux is used when the amount of physical memory (RAM) is full. If the system needs more memory resources and the RAM is full, inactive pages in memory are moved to the swap space. While swap space can help machines with a small amount of RAM, it should not be considered a replacement for more RAM. Swap space is located on hard drives, which have a slower access time than physical memory.

Swap空间存在于硬盘上,它的作用是当内存空间满了后,可以把当前内存中访问不是很频繁的页面放到swap上。


devfs,tmpfs和devtmpfs

以下摘自Specfs, Devfs, Tmpfs, and Others

specfs – specfs, or Special FileSystem, is a virtual filesystem used to access special device files. This filesystem is odd compared to other filesystems in general because this filesystem does not require a mount-point, yet the OS can still use specfs. However, specfs can be mounted by the user (mount -t specfs none /dev/streams). The device files for character devices in the /dev/ directory use specfs.

devfs – devfs is a device manager in the form of a filesystem. The Device FileSystem is largely the same as specfs except for some differences in the way they function and their uses. devfs is used for most of the device files in /dev/. Most Unix and Unix-like systems use devfs including Mac OS X, *BSD, and Solaris. Nearly all Unix and Unix-like systems that use devfs place it on the kernelspace. However, Linux uses a userspace-kernelspace hybrid approach. This means the devfs virtual filesystem is on the kernelspace and userspace.

tmpfs – The Temporary filesystem is a virtual filesystem for storing temporary files. This filesystem is really in the memory and/or in the swap space. Obviously, all data on this filesystem are lost when the system is shutdown. The mount point is /tmp/.

devtmpfs – This is an improved devfs. The purpose of devtmpfs is to boost boot-time. devtmpfs is more like tmpfs than devfs. The mount-point is /dev/. devtmpfs only creates device files for currently available hardware on the local system.

总结一下:
devfs是文件系统形式的device managertmpfs存在在内存和swap中,因此只能保存临时文件。devtmpfs是改进的devfs,也是存在内存中,挂载点是/dev/


如何理解Go程序发生panic时stack trace中的函数参数

Stack Traces In Go这篇文章主要讲了当Golang程序发生panic时,如何读懂stack trace中的函数参数。归纳为下面两个例子:

(1)

package main

import "fmt"

type trace struct{}

func main() {
    slice := make([]string, 2, 4)

    var t trace
    t.Example(slice, "hello", 10)
}

func (t *trace) Example(slice []string, str string, i int) {
    fmt.Printf("Receiver Address: %p\n", t)
    panic("Want stack trace")
} 

执行结果如下:

Receiver Address: 0x570560
panic: Want stack trace

goroutine 1 [running]:
main.(*trace).Example(0x570560, 0xc08201ff50, 0x2, 0x4, 0x4ecc10, 0x5, 0xa)
        C:/Work/gocode/src/Hello.go:16 +0x11d
main.main()
        C:/Work/gocode/src/Hello.go:11 +0xb5
......

可以看到,main.(*trace).Example包含6个参数:第一个(0x570560)是t的地址;接下来三个(0xc08201ff500x20x4)是slice的内容:指向底层数组的指针,lengthcapcity;接下来两个是字符串的内容:同slice相比,缺少了capcity;最后是10这个参数。

(2)

package main
func main() {
    Example(true, false, true, 25)
}

func Example(b1, b2, b3 bool, i uint8) {
    panic("Want stack trace")
}

执行结果如下:

panic: Want stack trace

goroutine 1 [running]:
main.Example(0x19010001)
        C:/Work/gocode/src/Hello.go:7 +0x6b
main.main()
        C:/Work/gocode/src/Hello.go:3 +0x39

上面4个参数每个都占据一个byte,编译器把它们打包在一个word中。


Go语言利用goroutine实现递归

Recursion And Tail Calls In Go这篇文章讲了用goroutine实现函数递归调用:这样做可以避免过多函数调用引起的堆栈空间的不断增大,感觉很巧妙。以下是例子代码:

package main
import "fmt"

func recursiveCall(product int, num int, ch chan int)  {
    product += num

    if num == 1 {
        ch <- product
        return
    }

    go recursiveCall(product, num - 1, ch)
}

func main()  {
    ch := make(chan int)
    go recursiveCall(0, 4, ch)
    product := <-ch
    fmt.Printf("Product is %d\n", product)
}  

执行结果如下:

Product is 10


Go语言的string和byte slice之间的转换

以下摘自The Go Programming Language

A string contains an array of bytes that, once created, is immutable. By contrast, the elements of a byte slice can be freely modified.

Strings can be converted to byte slices and back again:
s := “abc”
b := []byte(s)
s2 := string(b)

Conceptually, the []byte(s) conversion allocates a new byte array holding a copy of the bytes of s, and yields a slice that references the entirety of that array. An optimizing compiler may be able to avoid the allocation and copying in some cases, but in general copying is required to ensure that the bytes of s remain unchanged even if those of b are subsequently modified. The conversion from byte slice back to string with string(b) also makes a copy, to ensure immutability of the resulting string s2.

由于Go语言中字符串是不可修改的,因此如果要修改其中内容,就要把其转化成byte slice。此外,byte slice也可以转化成字符串。这两种转化都需要分配一块新的内存,然后进行内容拷贝。


使用vmstat命令监控CPU使用

vmstat命令可以用来监控CPU的使用状况。举例如下:

# vmstat 1
procs -----------memory---------- ---swap-- -----io---- -system-- ------cpu-----
 r  b   swpd   free   buff  cache   si   so    bi    bo   in   cs us sy id wa st
 1  0      0 5201924   1328 5578060    0    0     0     0 1582 6952  2  1 98  0  0
 1  0      0 5200984   1328 5577996    0    0     0     0 2020 20567  9  1 90  0  0
 0  0      0 5198668   1328 5577952    0    0     0     0 1568 7617  5  1 94  0  0
 0  0      0 5194844   1328 5578000    0    0     0   187 1249 7057  1  1 98  0  0
 0  0      0 5199956   1328 5578232    0    0     0     0 1496 7306  4  1 95  0  0

上述命令每隔1秒输出系统状态,最后5列是描述的是CPU状况。man手册上关于这5列的含义描述的很清楚:

CPU
       These are percentages of total CPU time.
       us: Time spent running non-kernel code.  (user time, including nice time)
       sy: Time spent running kernel code.  (system time)
       id: Time spent idle.  Prior to Linux 2.5.41, this includes IO-wait time.
       wa: Time spent waiting for IO.  Prior to Linux 2.5.41, included in idle.
       st: Time stolen from a virtual machine.  Prior to Linux 2.6.11, unknown.

vmstat实质上是从/proc/stat文件获得系统状态:

# cat /proc/stat
cpu  381584 711 299364 1398303520 429839 0 251 0 0 0
cpu0 90740 58 44641 174627550 131209 0 120 0 0 0
cpu1 43141 26 22925 174746812 108219 0 10 0 0 0
cpu2 41308 35 25097 174831161 25877 0 40 0 0 0
cpu3 39301 70 27514 174836084 27792 0 4 0 0 0
cpu4 39187 78 46191 174750027 109013 0 0 0 0 0
......

需要注意的是这里数字的单位是Jiffies

另外,vmstat计算CPU时间百分比使用的是“四舍五入”算法(vmstat.c):

static void new_format(void){
    ......
    duse = *cpu_use + *cpu_nic;
    dsys = *cpu_sys + *cpu_xxx + *cpu_yyy;
    didl = *cpu_idl;
    diow = *cpu_iow;
    dstl = *cpu_zzz;
    Div = duse + dsys + didl + diow + dstl;
    if (!Div) Div = 1, didl = 1;
    divo2 = Div / 2UL;
    printf(w_option ? wide_format : format,
           running, blocked,
           unitConvert(kb_swap_used), unitConvert(kb_main_free),
           unitConvert(a_option?kb_inactive:kb_main_buffers),
           unitConvert(a_option?kb_active:kb_main_cached),
           (unsigned)( (unitConvert(*pswpin  * kb_per_page) * hz + divo2) / Div ),
           (unsigned)( (unitConvert(*pswpout * kb_per_page) * hz + divo2) / Div ),
           (unsigned)( (*pgpgin        * hz + divo2) / Div ),
           (unsigned)( (*pgpgout           * hz + divo2) / Div ),
           (unsigned)( (*intr          * hz + divo2) / Div ),
           (unsigned)( (*ctxt          * hz + divo2) / Div ),
           (unsigned)( (100*duse            + divo2) / Div ),
           (unsigned)( (100*dsys            + divo2) / Div ),
           (unsigned)( (100*didl            + divo2) / Div ),
           (unsigned)( (100*diow            + divo2) / Div ),
           (unsigned)( (100*dstl            + divo2) / Div )
    );
    ......
}

所以会出现CPU利用百分比相加大于100的情况:2 + 1 + 98 = 101

另外,在Linux系统上,r字段表示的是当前正在运行和等待运行的task的总和。


参考资料:
/proc/stat explained
procps