The tips of debugging Mesos

In the past week, I was following this tutorial to build a “kubernetes on Mesos” testbed. All went well but the Mesos master always complains following words:

......
E1228 21:57:13.138357 27257 process.cpp:1911] Failed to shutdown socket with fd 17: Transport endpoint is not connected
......

Firstly, I tried to get help from Mesos mailing list and stackoverflow, but after other friends can’t give correct answers directly, I knew I must depend on myself. Enduring a tough debugging process, I worked out the root cause. Since I am a newbie of Mesos and C++(Mesos is implemented in C++, and I last time touch C++ was 7 years ago), I think the experiences and tips may also be useful for other novices. So I summarize them as the following words:

(1) LOG VS VLOG

When you meet an issue, analyzing log should be the first step. Mesos utilizes the google-glog to generate the logs. And the log format explanation is here:

Log lines have this form:
    Lmmdd hh:mm:ss.uuuuuu threadid file:line] msg...
where the fields are defined as follows:
    L                A single character, representing the log level (eg 'I' for INFO)
    mm               The month (zero padded; ie May is '05')
    dd               The day (zero padded)
    hh:mm:ss.uuuuuu  Time in hours, minutes and fractional seconds
    threadid         The space-padded thread ID as returned by GetTID()
    file             The file name
    line             The line number
    msg              The user-supplied message

So compared with the above words, you can easily understand this log:

E1228 21:57:13.138357 27257 process.cpp:1911] Failed to shutdown socket with fd 17: Transport endpoint is not connected

By default, the Mesos doesn’t output logs generated by VLOG function, and you need to set GLOG_v=m if you want to see the information from VLOG function (Refer this post):

$ sudo GLOG_v=3 ./bin/mesos-master.sh --ip=15.242.100.56 --work_dir=/var/lib/mesos
WARNING: Logging before InitGoogleLogging() is written to STDERR
I1229 22:42:38.818521 11830 process.cpp:2426] Spawned process __gc__@15.242.100.56:5050
I1229 22:42:38.818613 11846 process.cpp:2436] Resuming __gc__@15.242.100.56:5050 at 2015-12-30 03:42:38.818540032+00:00
I1229 22:42:38.818749 11847 process.cpp:2436] Resuming __gc__@15.242.100.56:5050 at 2015-12-30 03:42:38.818712832+00:00
I1229 22:42:38.818802 11844 process.cpp:2436] Resuming help@15.242.100.56:5050 at 2015-12-30 03:42:38.818746112+00:00
......

You can also use LOG function to add logs yourself on suspected locations.

(2) Gdb

If logs can’t save you, it is time for debugger to be your hero. Gdb is no doubt a great tool of debugging C/C++ programs. To use gdb, you should enable --enable-debug configuration option before compiling Mesos:

nan@ubuntu:~/mesos-0.25.0/build$ ../configure --enable-debug

You can set breakpoint on class member function like this:

(gdb) b process::SocketManager::close(int)
Breakpoint 1 at 0x7fd07857c162: file ../../../3rdparty/libprocess/src/process.cpp, line 1849.

You can also make use of “auto-complete” feature of gdb. Input the uncompleted function name:

(gdb) b process::SocketManager::cl  

Then click tab:

(gdb) b process::SocketManager::close(int)
Breakpoint 1 at 0x7fd07857c162: file ../../../3rdparty/libprocess/src/process.cpp, line 1849.

Notice: If the matched symbols are too many, it may hang gdb. So try to reduce the scope as small as possible.

Additionally, since source file names are relative to the directory where the code was compiled (please refer breakpoints in GDB),you can reach the same effect through “b file:line“command :

(gdb) b ../../../3rdparty/libprocess/src/process.cpp:1279
Breakpoint 2 at 0x7fd07857973a: file ../../../3rdparty/libprocess/src/process.cpp, line 1279.
(gdb) c
Continuing.
......
[Switching to Thread 0x7fd06b9d4700 (LWP 16677)]

Breakpoint 2, process::SocketManager::link_connect (this=0xca1a30, future=..., socket=0x7fd0500026d0, to=...)
    at ../../../3rdparty/libprocess/src/process.cpp:1279
1279      if (future.isDiscarded() || future.isFailed()) {

You can see the breakpoint is set onprocess::SocketManager::link_connect(process::Future<Nothing> const&, process::network::Socket*, process::UPID const&)function.

P.S.:There are also handy out-of-box gdb scripts in build/bin directory:

# ls bin/gdb-mesos-*
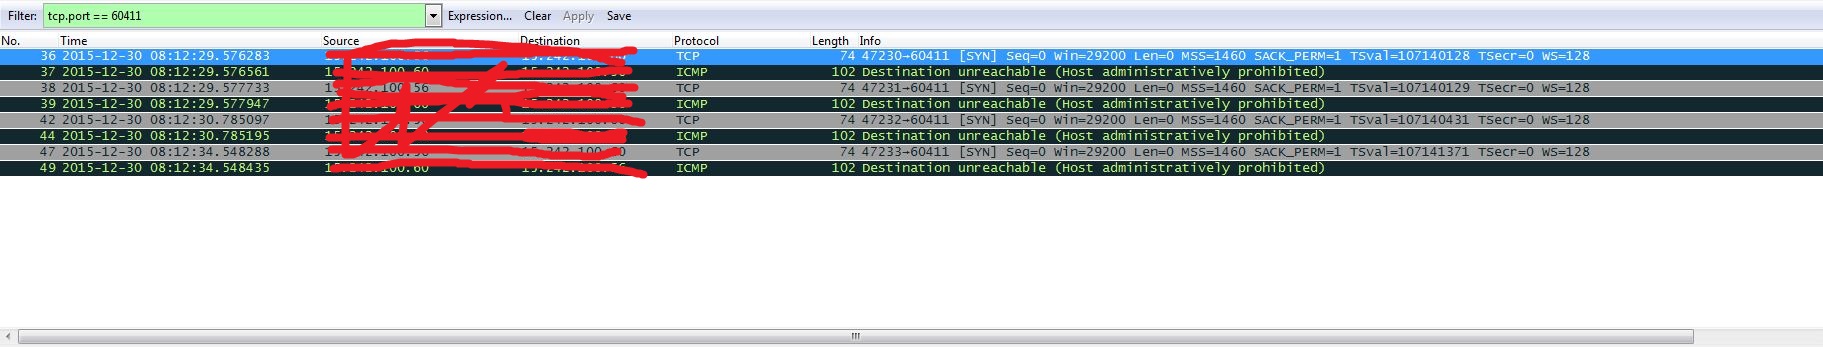
bin/gdb-mesos-local.sh  bin/gdb-mesos-master.sh  bin/gdb-mesos-slave.sh  bin/gdb-mesos-tests.sh

(3) Tcpdump and wireshark

Network packet analyzing tools such as tcpdump and wireshark are essential to diagnose programs which interact with other hosts. E.g., you can use following command to see what come in and out of Mesos master:

sudo tcpdump -A -s 0 'tcp port 5050' -i em1 -w capture.pcap

BTW, my issue is finally fixed by analyzing the following packet:

1

(4) Pstack script

Personally, I think pstack script is useful when monitoring thread status, and please refer Use pstack to track threads on Linux for detail.

Enjoy debugging!


Install libstdc++ debug package on Ubuntu

When using pstack script to analyze the thread stacks of process on Ubuntu, there may be some unresolved symbols, like ??:

......
Thread 3 (Thread 0x7f71513f3700 (LWP 10049)):
#0  0x00007f716399cb13 in epoll_wait ()
#1  0x00007f71688569e5 in epoll_poll (
#2  0x00007f7168858c72 in ev_run (loop=0x7f71697e44e0 <default_loop_struct>,
#3  0x00007f716881cf16 in ev_loop ()
#4  0x00007f716881d680 in process::EventLoop::run ()
#5  0x00007f7168808141 in std::_Bind_simple<void (*())()>::_M_invoke<>(std::_Index_tuple<>) () from /home/nan/mesos-0.26.0/build/src/.libs/libmesos-0.26.0.so
#6  0x00007f716880809b in std::_Bind_simple<void (*())()>::operator()() ()
#7  0x00007f7168808034 in std::thread::_Impl<std::_Bind_simple<void (*())()> >::_M_run() () from /home/nan/mesos-0.26.0/build/src/.libs/libmesos-0.26.0.so
#8  0x00007f7164234a40 in ?? () from /usr/lib/x86_64-linux-gnu/libstdc++.so.6
#9  0x00007f716448f182 in start_thread (arg=0x7f71513f3700)
#10 0x00007f716399c47d in clone ()
......

To resolve this issue, firstly, you need to know the libstdc++6 version:

$ g++ -v
Using built-in specs.
COLLECT_GCC=g++
COLLECT_LTO_WRAPPER=/usr/lib/gcc/x86_64-linux-gnu/4.8/lto-wrapper
Target: x86_64-linux-gnu
Configured with: ../src/configure -v --with-pkgversion='Ubuntu 4.8.4-2ubuntu1~14.04' --with-bugurl=file:///usr/share/doc/gcc-4.8/README.Bugs --enable-languages=c,c++,java,go,d,fortran,objc,obj-c++ --prefix=/usr --program-suffix=-4.8 --enable-shared --enable-linker-build-id --libexecdir=/usr/lib --without-included-gettext --enable-threads=posix --with-gxx-include-dir=/usr/include/c++/4.8 --libdir=/usr/lib --enable-nls --with-sysroot=/ --enable-clocale=gnu --enable-libstdcxx-debug --enable-libstdcxx-time=yes --enable-gnu-unique-object --disable-libmudflap --enable-plugin --with-system-zlib --disable-browser-plugin --enable-java-awt=gtk --enable-gtk-cairo --with-java-home=/usr/lib/jvm/java-1.5.0-gcj-4.8-amd64/jre --enable-java-home --with-jvm-root-dir=/usr/lib/jvm/java-1.5.0-gcj-4.8-amd64 --with-jvm-jar-dir=/usr/lib/jvm-exports/java-1.5.0-gcj-4.8-amd64 --with-arch-directory=amd64 --with-ecj-jar=/usr/share/java/eclipse-ecj.jar --enable-objc-gc --enable-multiarch --disable-werror --with-arch-32=i686 --with-abi=m64 --with-multilib-list=m32,m64,mx32 --with-tune=generic --enable-checking=release --build=x86_64-linux-gnu --host=x86_64-linux-gnu --target=x86_64-linux-gnu
Thread model: posix
gcc version 4.8.4 (Ubuntu 4.8.4-2ubuntu1~14.04)

Then search the debug files of the 4.8.4 version:

~$ sudo apt-cache search libstdc++ | grep 4.8
......
libstdc++6-4.8-dbg - GNU Standard C++ Library v3 (debugging files)
......

Install libstdc++6-4.8-dbg:

$ sudo apt-get install libstdc++6-4.8-dbg
Reading package lists... Done
Building dependency tree
Reading state information... Done
......

The symbols can be resolved now:

......
Thread 3 (Thread 0x7f71513f3700 (LWP 10049)):
#0  0x00007f716399cb13 in epoll_wait ()
#1  0x00007f71688569e5 in epoll_poll (
#2  0x00007f7168858c72 in ev_run (loop=0x7f71697e44e0 <default_loop_struct>,
#3  0x00007f716881cf16 in ev_loop ()
#4  0x00007f716881d680 in process::EventLoop::run ()
#5  0x00007f7168808141 in std::_Bind_simple<void (*())()>::_M_invoke<>(std::_Index_tuple<>) () from /home/nan/mesos-0.26.0/build/src/.libs/libmesos-0.26.0.so
#6  0x00007f716880809b in std::_Bind_simple<void (*())()>::operator()() ()
#7  0x00007f7168808034 in std::thread::_Impl<std::_Bind_simple<void (*())()> >::_M_run() () from /home/nan/mesos-0.26.0/build/src/.libs/libmesos-0.26.0.so
#8  0x00007f7164234a40 in std::(anonymous namespace)::execute_native_thread_routine (__p=<optimized out>)
#9  0x00007f716448f182 in start_thread (arg=0x7f71513f3700)
#10 0x00007f716399c47d in clone ()
......


Fix “Unable to install GRUB in /dev/sda” error during installing Ubuntu

Today, I met “Unable to install GRUB in /dev/sda” error during installing Ubuntu 14.04 server:

2

3 Suddenly, I remembered the OS was not installed on /dev/sda, but /dev/sdc:

1 So in “Install the GRUB boot loader on a hard disk” step, I should select No:

4

Then filled /dev/sdc as the right installation hard disk.

5

It worked!


The tips of using gdb to debug Golang program

Although “GDB does not understand Go programs well.” (from Debugging Go Code with GDB), sometimes gdb is still a useful tool for debugging Golang program. In this post, I will show some small tips.

(1)

My OS is Ubuntu 14.04. Launching gdb, it prompts following things:

......
warning: File "/usr/local/go/src/runtime/runtime-gdb.py" auto-loading has been declined by your `auto-load safe-path' set to "$debugdir:$datadir/auto-load".
To enable execution of this file add
        add-auto-load-safe-path /usr/local/go/src/runtime/runtime-gdb.py
line to your configuration file "/home/nan/.gdbinit".
To completely disable this security protection add
        set auto-load safe-path /
line to your configuration file "/home/nan/.gdbinit".
For more information about this security protection see the
"Auto-loading safe path" section in the GDB manual.  E.g., run from the shell:
        info "(gdb)Auto-loading safe path"
......

So I add “add-auto-load-safe-path /usr/local/go/src/runtime/runtime-gdb.py” in my .gdbinit file. My preferred .gdbinit file is like this:

$ cat ${HOME}/.gdbinit
add-auto-load-safe-path /usr/local/go/src/runtime/runtime-gdb.py
set confirm off
set print pretty on

(2)

If you want to set breakpoint on the start of main function, you should use “b main.main“:

......
(gdb) b main.main
Breakpoint 1 at 0x4021e0: file /home/nan/kubernetes/_output/local/go/src/k8s.io/kubernetes/cmd/kubectl/kubectl.go, line 26.
(gdb) r
Starting program: /home/nan/kubernetes/_output/local/go/bin/kubectl
[Thread debugging using libthread_db enabled]
Using host libthread_db library "/lib/x86_64-linux-gnu/libthread_db.so.1".
[New Thread 0x7ffff77f6700 (LWP 957)]
[New Thread 0x7ffff6fb5700 (LWP 958)]
[New Thread 0x7ffff5fb3700 (LWP 960)]
[New Thread 0x7ffff67b4700 (LWP 959)]

Breakpoint 1, main.main () at /home/nan/kubernetes/_output/local/go/src/k8s.io/kubernetes/cmd/kubectl/kubectl.go:26
26      func main() {
......

Not “b main“, except you want to read mysterious assembly code:

......
(gdb) b main
Breakpoint 1 at 0x45e830: file /usr/local/go/src/runtime/rt0_linux_amd64.s, line 63.
(gdb) r
Starting program: /home/nan/kubernetes/_output/local/go/bin/kubectl
[Thread debugging using libthread_db enabled]
Using host libthread_db library "/lib/x86_64-linux-gnu/libthread_db.so.1".

Breakpoint 1, main () at /usr/local/go/src/runtime/rt0_linux_amd64.s:63
63              MOVQ    $runtime·rt0_go(SB), AX
(gdb)
......

(3)

If you don’t know the symbol name of a function, you can use readelf tool. E.g.:

$ readelf -s -W /home/nan/kubernetes/_output/local/go/bin/kubectl | grep NewCmdConfig
 ......
 14350: 0000000000766da0  3168 FUNC    LOCAL  DEFAULT   14 k8s.io/kubernetes/pkg/kubectl/cmd/config.NewCmdConfig
 ......
 14404: 00000000007745d0    48 FUNC    LOCAL  DEFAULT   14 k8s.io/kubernetes/pkg/kubectl/cmd/config.NewCmdConfig.func1

The config.NewCmdConfig.func1 is the function which is defined in NewCmdConfig function:

func NewCmdConfig(pathOptions *PathOptions, out io.Writer) *cobra.Command {
    ......
        Run: func(cmd *cobra.Command, args []string) {
            cmd.Help()
    ......
}

Then you can set breakpoint for wanted function:

......
(gdb) b k8s.io/kubernetes/pkg/kubectl/cmd/config.NewCmdConfig
Breakpoint 1 at 0x766da0: file /home/nan/kubernetes/_output/local/go/src/k8s.io/kubernetes/pkg/kubectl/cmd/config/config.go, line 63.
(gdb) r
Starting program: /home/nan/kubernetes/_output/local/go/bin/kubectl
[Thread debugging using libthread_db enabled]
Using host libthread_db library "/lib/x86_64-linux-gnu/libthread_db.so.1".
[New Thread 0x7ffff77f6700 (LWP 1416)]
[New Thread 0x7ffff6fb5700 (LWP 1417)]
[New Thread 0x7ffff67b4700 (LWP 1418)]
[New Thread 0x7ffff5fb3700 (LWP 1419)]

Breakpoint 1, k8s.io/kubernetes/pkg/kubectl/cmd/config.NewCmdConfig (pathOptions=0xc820178b90, out=..., ~r2=0x1)
    at /home/nan/kubernetes/_output/local/go/src/k8s.io/kubernetes/pkg/kubectl/cmd/config/config.go:63
63      func NewCmdConfig(pathOptions *PathOptions, out io.Writer) *cobra.Command {
(gdb)
......


Execute “mesos-slave.sh” using root privilege

I have spent the past week to try building “Kubernetes on Mesos” following Getting started with Kubernetes on Mesos document, but “kubectl get node” always reports the node state is not ready:

$ kubectl get node
NAME      LABELS                          STATUS     AGE
ubuntu    kubernetes.io/hostname=ubuntu   NotReady   4h

Today, when executing “./bin/mesos-slave.sh --master=127.0.0.1:5050” command, I notice this log:

W1217 05:52:42.213497 24074 backend.cpp:50] Failed to create 'bind' backend: BindBackend requires root privileges

So I use sudo command to run the ./bin/mesos-slave.sh script again, then the “Kubernetes on Mesos” runs successfully:


Capture