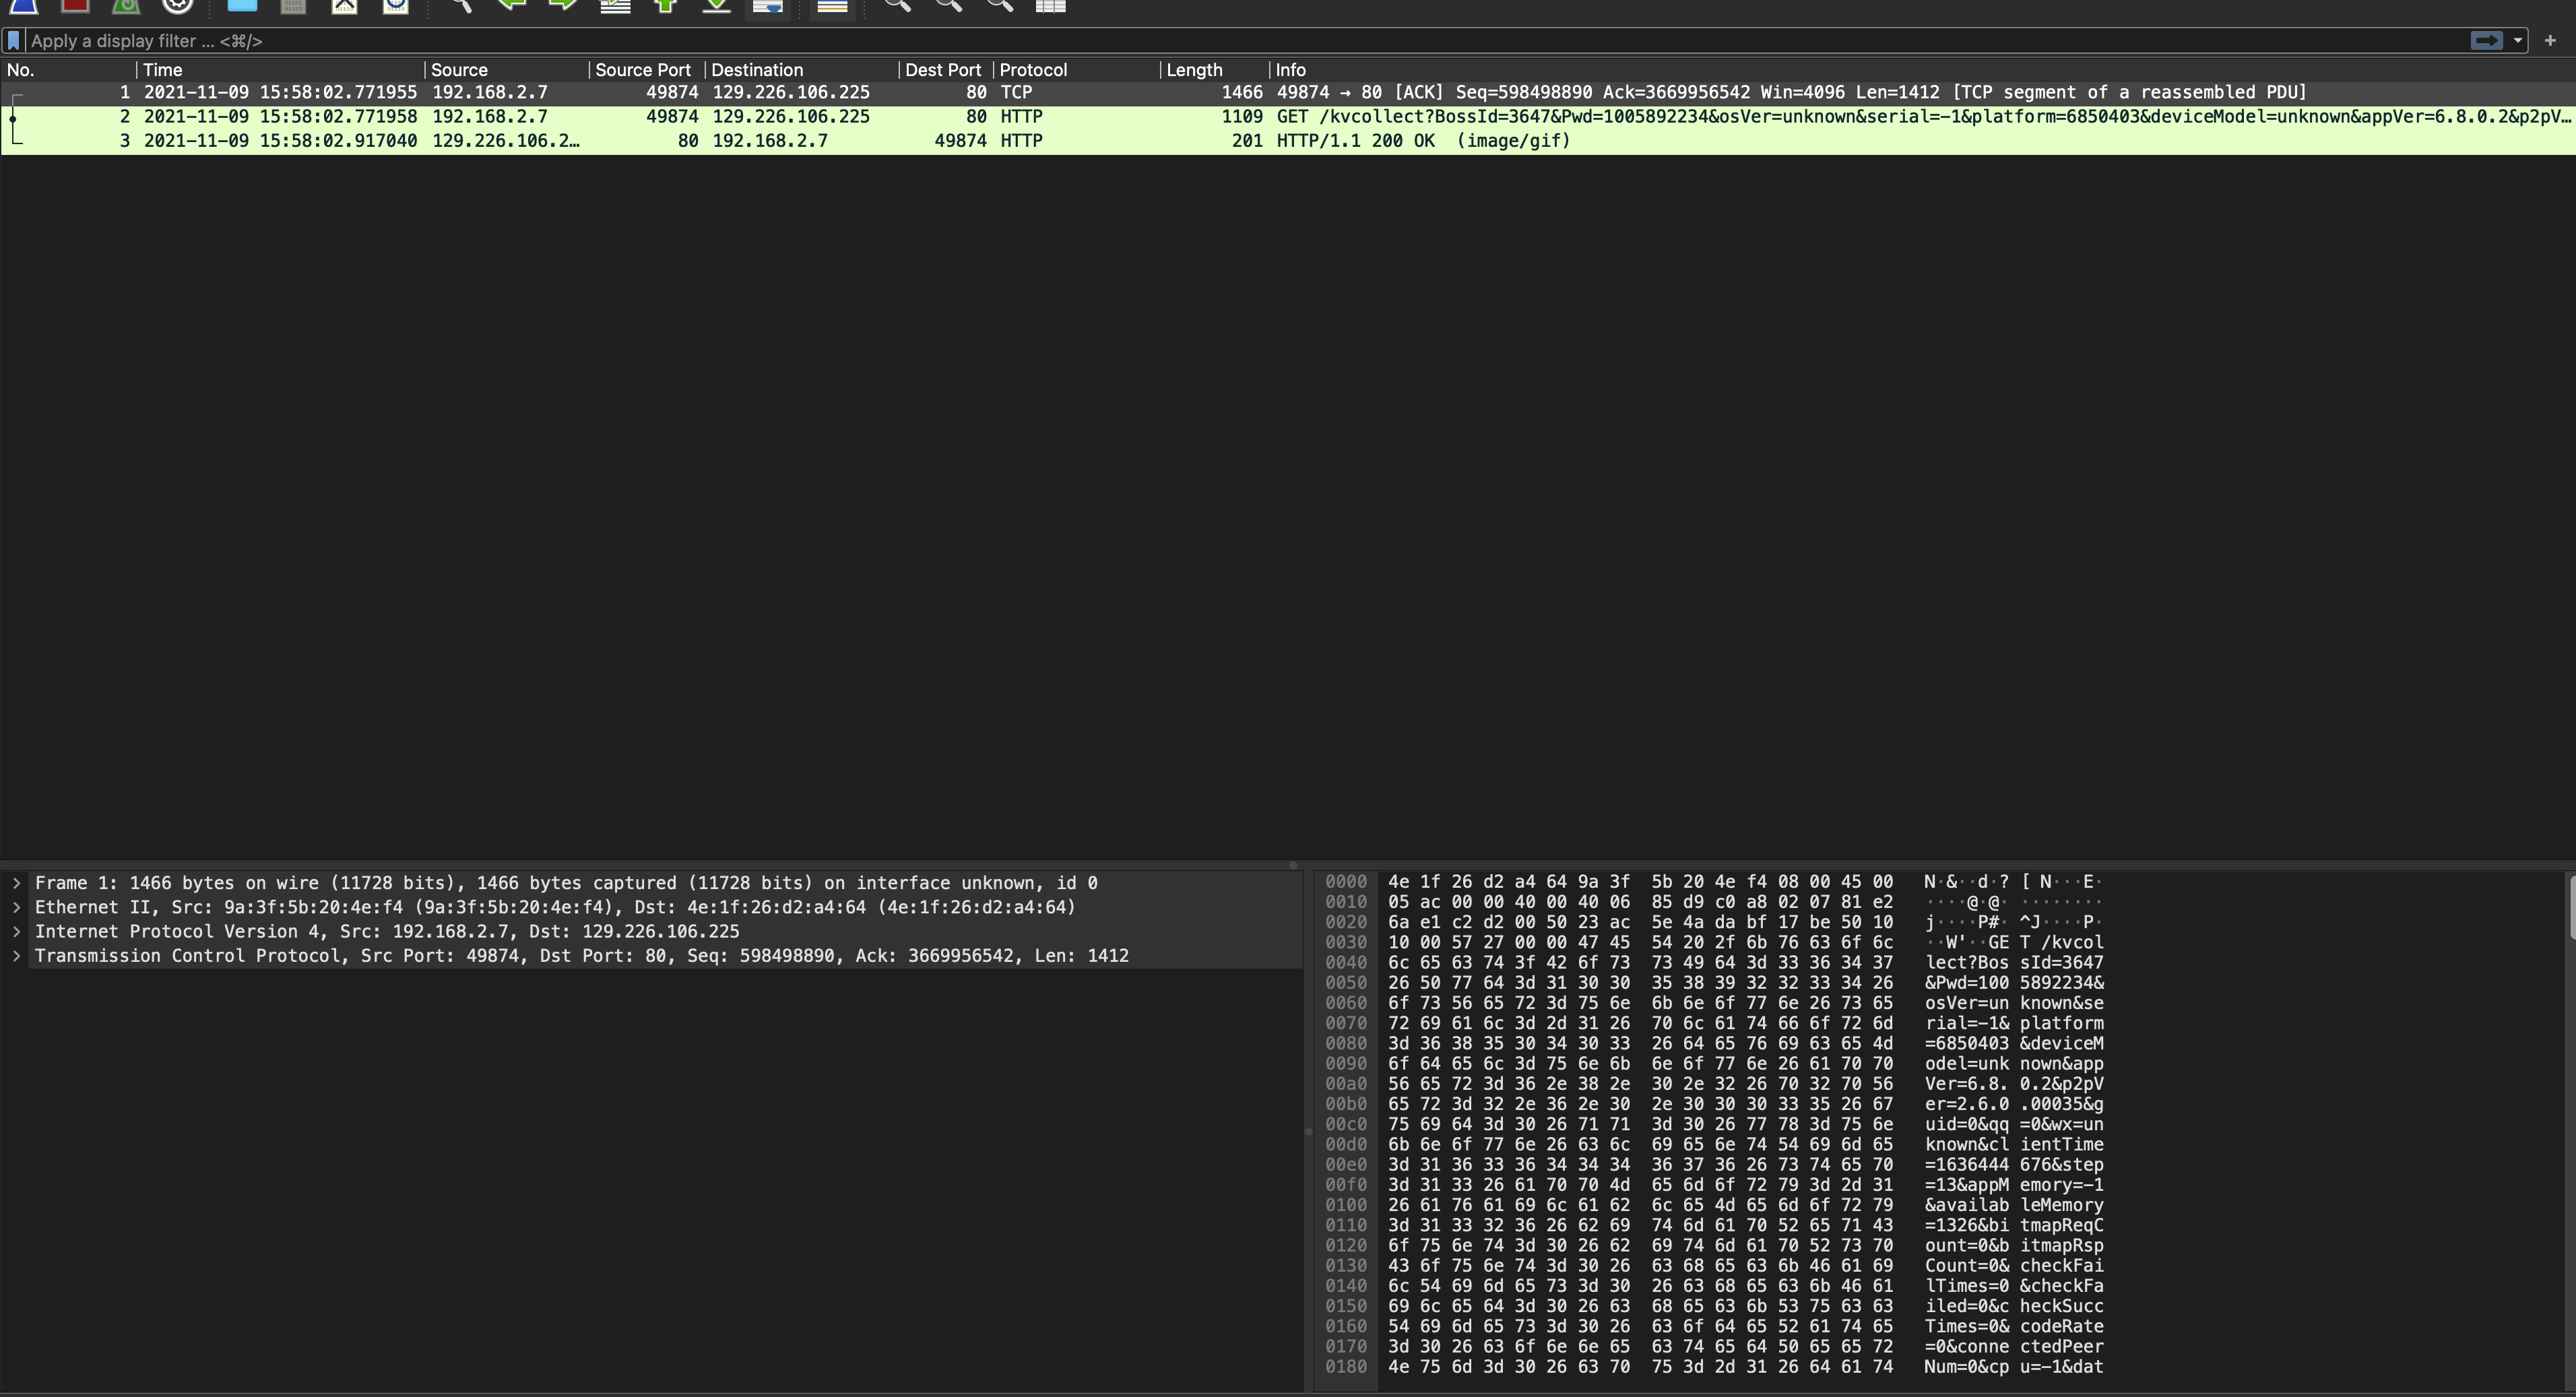
Build tshark on CentOS 7

I want to build & debug tshark on CentOS 7 (No need GUI), and the first step is installing cmake3:

$ sudo yum install cmake3

Create a build directory under Wireshark source code, and Run following commands:

$ cd build
$ cmake3 -DBUILD_wireshark=OFF -DCMAKE_BUILD_TYPE=Debug ..
$ make

That’s it!

References:
How to build and install tshark without Wireshark?;
Wireshark docs.

Enhance libunwind on illumos

In my last post, I mentioned that I used libunwind to debug a memory leak issue recently. I actually run this program on illumos too, but unfortunately met following errors:

$ cat /tmp/backtrace.log
0x401b3b: -- error(unspecified (general) error): unable to obtain symbol name for this frame
0x401b47: -- error(unspecified (general) error): unable to obtain symbol name for this frame
0x401b5e: -- error(unspecified (general) error): unable to obtain symbol name for this frame
0x401757: -- error(unspecified (general) error): unable to obtain symbol name for this frame
0x4016b8: -- error(unspecified (general) error): unable to obtain symbol name for this frame

I used gdb to do single-step debug, then found the libunwind illumos implementation just reuses the Linux APIs:

......
#include "os-linux.h" // using linux header for map_iterator implementation
......

On Linux, the map file is /proc/$pid/maps, but on illumos, the file is /proc/$pid/map. Hmm, the first step is wrong, then no need to progress further.

I tried to see what is in /proc/$pid/map:

$ cat /proc/$$/map
cat: input error on /proc/511/map: Value too large for defined data type

cat couldn’t help. Then resorted to vim:

$ vim /proc/$$/map
^@^@@^@......

Just messy code. Now that it is not plain test, how to decrypt it? Aha, since pmap can display it correctly:

$ pmap $$
511:    -bash
0000000000400000        828K r-x--  /usr/bin/bash
00000000004DE000         20K rw---  /usr/bin/bash
00000000004E3000         60K rw---  /usr/bin/bash
0000000000F09000       1872K rw---    [ heap ]
FFFFFC7FEC110000          4K rwx--    [ anon ]
......

Let me check pmap implementation. After going through pmap code, I found I should use libproc APIs to extract related information. I referred the code from pmap and implemented a total new tdep_get_elf_image API, and it worked:

$ cat /tmp/backtrace.log
0x401b3b: (foo+0x9)
0x401b47: (bar+0x9)
0x401b5e: (main+0x14)
0x401757: (_start_crt+0x87)
0x4016b8: (_start+0x18)

I submitted a Pull Request as well, and hope it can be finally merged.

Use libunwind to debug memory leak issue

In our project, there is a shared object with a reference counter, which will be increased if others acquire it and decreased if released. Once the reference counter is 0, the shared object can be reaped. Then we found the classical memory leak issue, i.e., the memory of shared object keeps growing. To debug this issue, I used libunwind.

The principle is simple: print the stack traces of every increment/decrement operations. I borrowed code from Programmatic access to the call stack in C++, and did some tweaks: mostly format the stack traces and output to file. The output is like this:

$ cat /tmp/backtrace.log
0x55ad59ec2556: (foo+0x9)
0x55ad59ec2562: (bar+0x9)
0x55ad59ec2579: (main+0x14)
0x7f941161ee0a: (__libc_start_main+0xea)
0x55ad59ec214a: (_start+0x2a)

A quick method to know the specific position in source code is through gdb: attach the program, then use “info line” command:

$ gdb program -p pid
......
(gdb) info line *0x55ad59ec2556
......

P.S., the code can be download here.

Use “LC_ALL=C” to improve performance

Using “LC_ALL=C” can improve some program’s performance. The following is the test without LC_ALL=C of join program:

$ locale
LANG=en_US.UTF-8
LC_CTYPE="en_US.UTF-8"
LC_NUMERIC="en_US.UTF-8"
LC_TIME="en_US.UTF-8"
LC_COLLATE="en_US.UTF-8"
LC_MONETARY="en_US.UTF-8"
LC_MESSAGES="en_US.UTF-8"
LC_PAPER="en_US.UTF-8"
LC_NAME="en_US.UTF-8"
LC_ADDRESS="en_US.UTF-8"
LC_TELEPHONE="en_US.UTF-8"
LC_MEASUREMENT="en_US.UTF-8"
LC_IDENTIFICATION="en_US.UTF-8"
LC_ALL=
$ sudo sh -c "sync; echo 3 > /proc/sys/vm/drop_caches"
$ time join 1.sorted 2.sorted > 1-2.sorted.aggregated

real    0m49.903s
user    0m48.427s
sys 0m0.786s

And this one is using “LC_ALL=C“:

$ sudo sh -c "sync; echo 3 > /proc/sys/vm/drop_caches"
$ time LC_ALL=C join 1.sorted 2.sorted > 1-2.sorted.aggregated

real    0m12.752s
user    0m5.628s
sys 0m0.971s

some good references about this topic are Speed up grep searches with LC_ALL=C and Everyone knows grep is faster in the C locale.