My 101st English post

How time flies! I have finished 100 English blog posts!

Back to 3 years ago, although I am a non-native English speaker, I decided to open English blogs. Since writing articles using my mother tongue can only let people who understand Chinese to read, while use English can benefit guys all over the world.

During the 100 posts, 95 percents are related to software technology, in other words, they are actually some experience and lessons which I have studied from daily work. I am very glad that these small essays can help other people on the earth. For example, I once received an email from a student who read my SAP HANA related posts and wanted to discuss some problems about using SAP HANA in container environment. Another sample is a trick of using Go: Fix “unsupported protocol scheme” issue in golang. This tip not only helps a lot of people and becomes the first item in google search, but also is translated into Chinese!

Besides gaining satisfactions, writing blog also enhances my English writing skills. Although there are still grammar and using words errors. Compared to the beginning, it is a really giant improvement!

I will continue to blogging, and look forward the next 100 posts!
Switch to https when git protocol doesn’t work

For many reasons (such as Firewall), you can’t clone from remote server’s git port(by default: 9418) correctly. For example:

# git clone git://git.kernel.org/pub/scm/linux/kernel/git/acme/linux -b perf/core
Cloning into 'linux'...

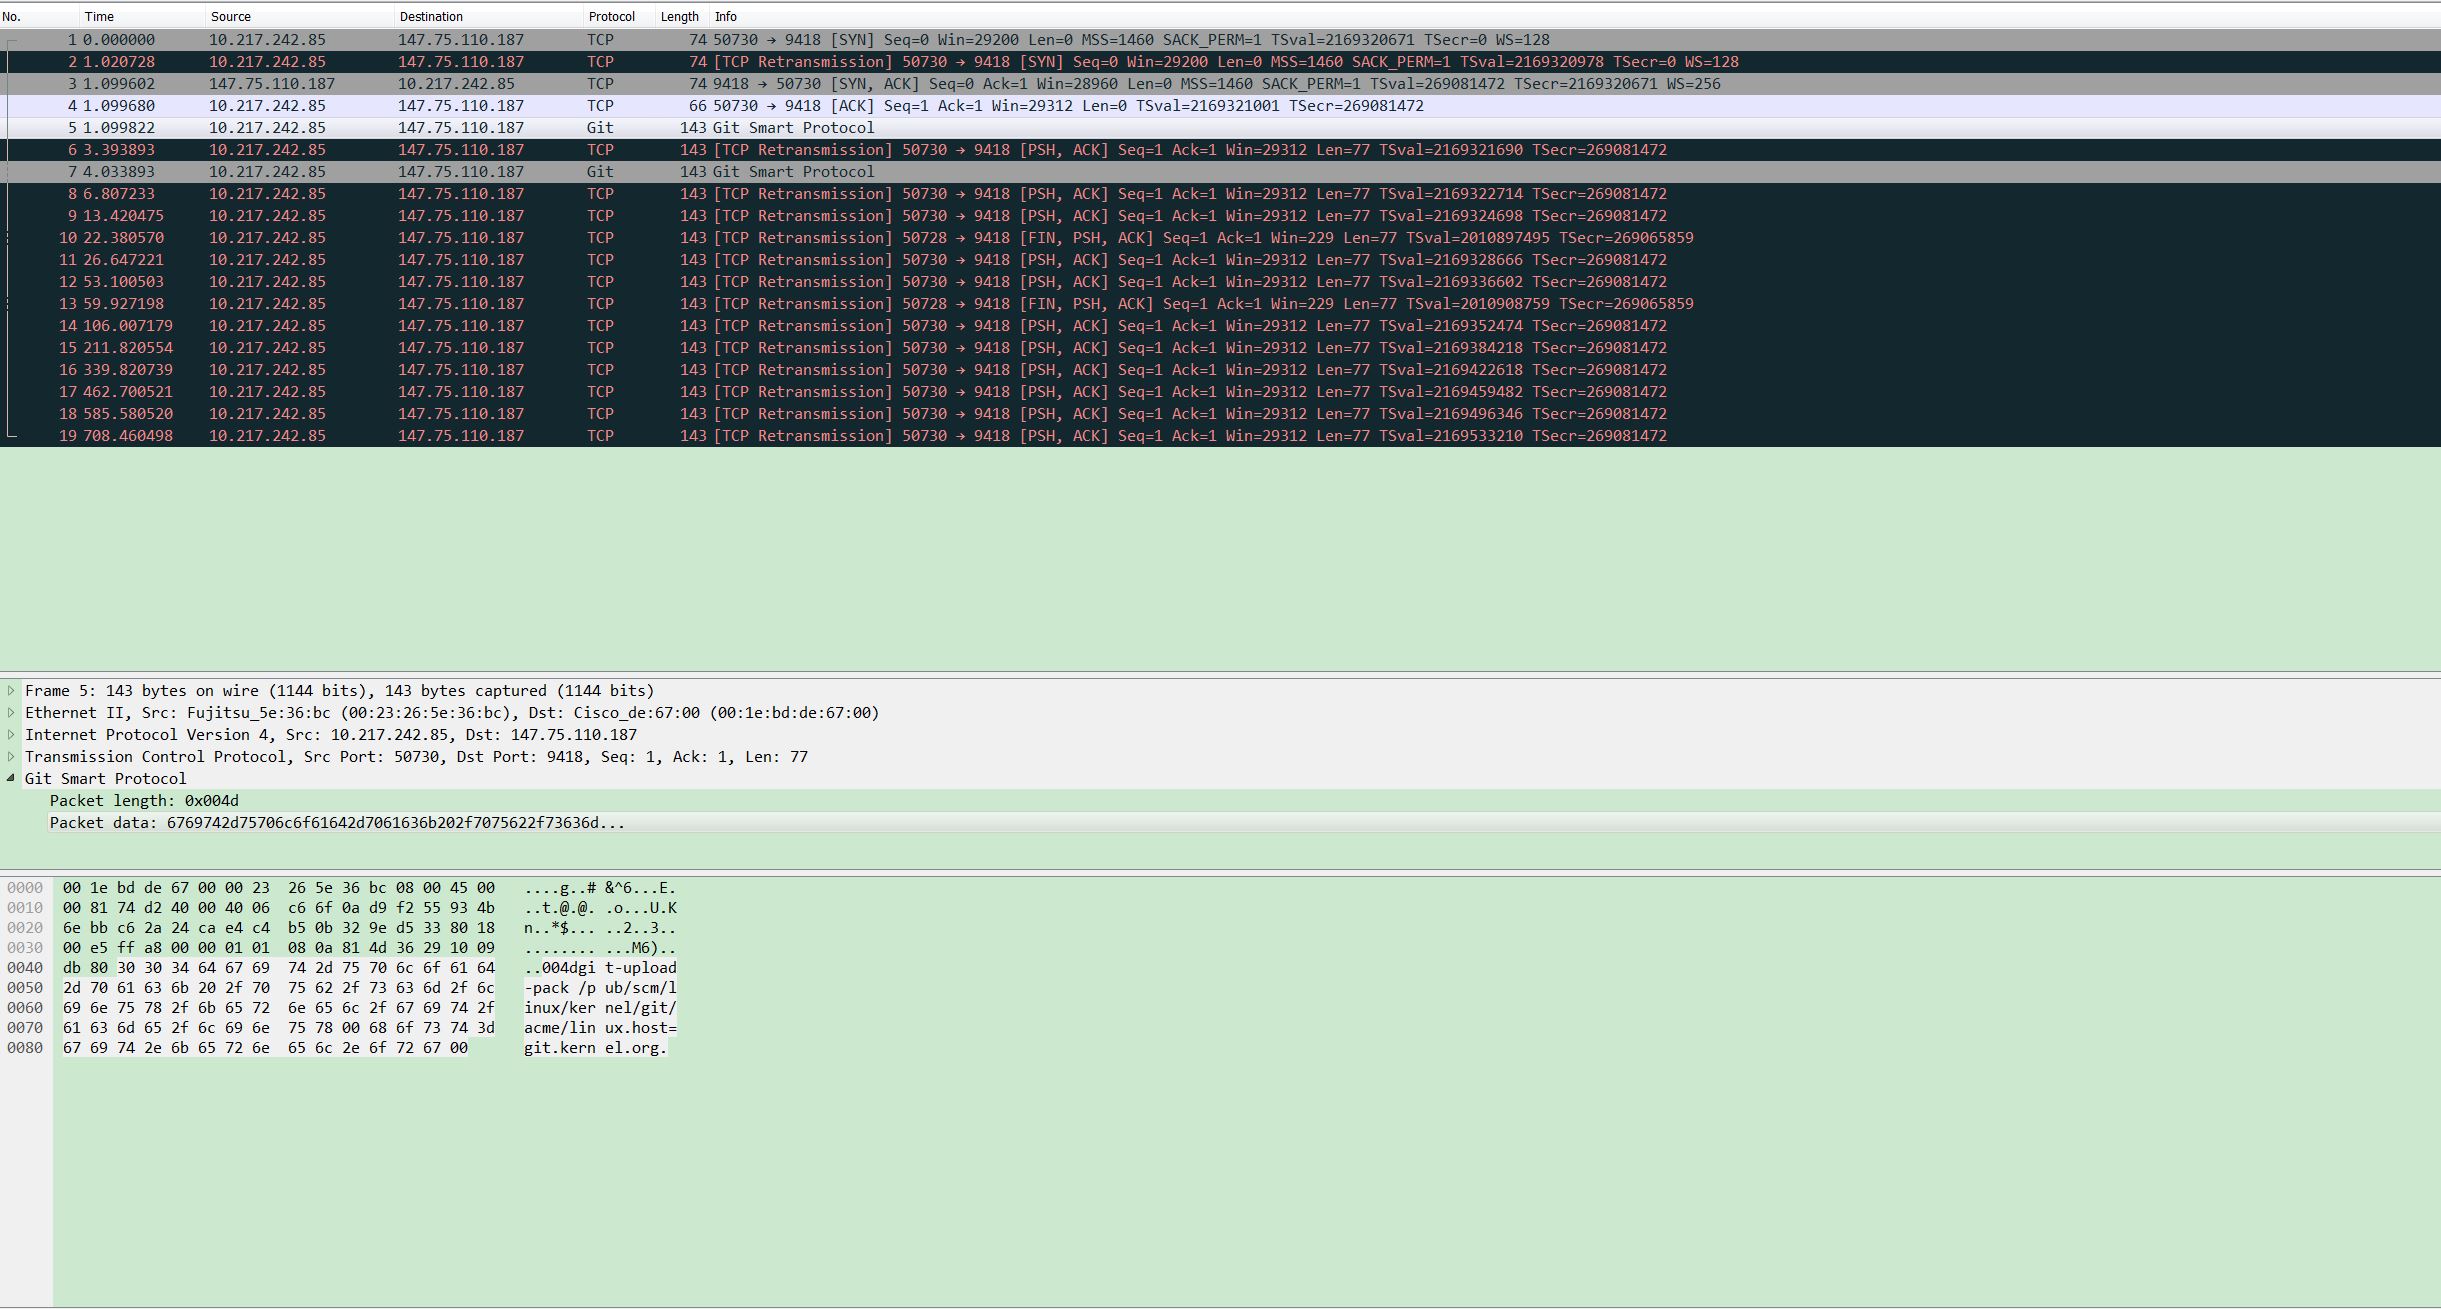
From the captured packet:

CSf6q

You can see the TCP connection is established, then no any response! You can switch to https or http protocol, it may save your life:

# git clone https://git.kernel.org/pub/scm/linux/kernel/git/acme/linux -b perf/core
Cloning into 'linux'...
POST git-upload-pack (gzip 25015 to 12570 bytes)
remote: Counting objects: 5287534, done.
......

Please refer the discussion here.

Use perf and FlameGraph to profile program on Linux

In most Linux environments, the perf tools should be set up by default. Otherwise, you can install it manually. E.g., in ArchLinux:

# pacman -S perf

Use following program as an example (It is a rifacimento from here, and you should only focus on the framework of the code):

# cat test.cpp
#include <NTL/ZZX.h>

using namespace std;
using namespace NTL;

void inner(int i, ZZX& t, Vec<ZZX>& phi)
{
        for (long j = 1; j <= i-1; j++)
         if (i % j == 0)
            t *= phi(j);
}

void outer(int i, Vec<ZZX>& phi)
{
        ZZX t;
        t = 1;
        inner(i, t, phi);
        phi(i) = (ZZX(INIT_MONO, i) - 1)/t;
        cout << phi(i) << "\n";
}

int main()
{
   Vec<ZZX> phi(INIT_SIZE, 100);

   for (long i = 1; i <= phi.length(); i++) {
      outer(i, phi);
   }
}

Compile it:

# g++ -g -O2 -pthread test.cpp -lntl -lgmp

It is suggested that using -g -O2 options since -g can provide debug information which perf needs and -O2 can generate lots of optimizations.

Use perf record to sample the program:

# perf record --call-graph dwarf ./a.out
......
[ perf record: Woken up 2 times to write data ]
[ perf record: Captured and wrote 0.318 MB perf.data (38 samples) ]

To profile an already running program, use -p pid flag. A perf.data file will be generated in current directory, and you can use perf report command to parse it:

# perf report

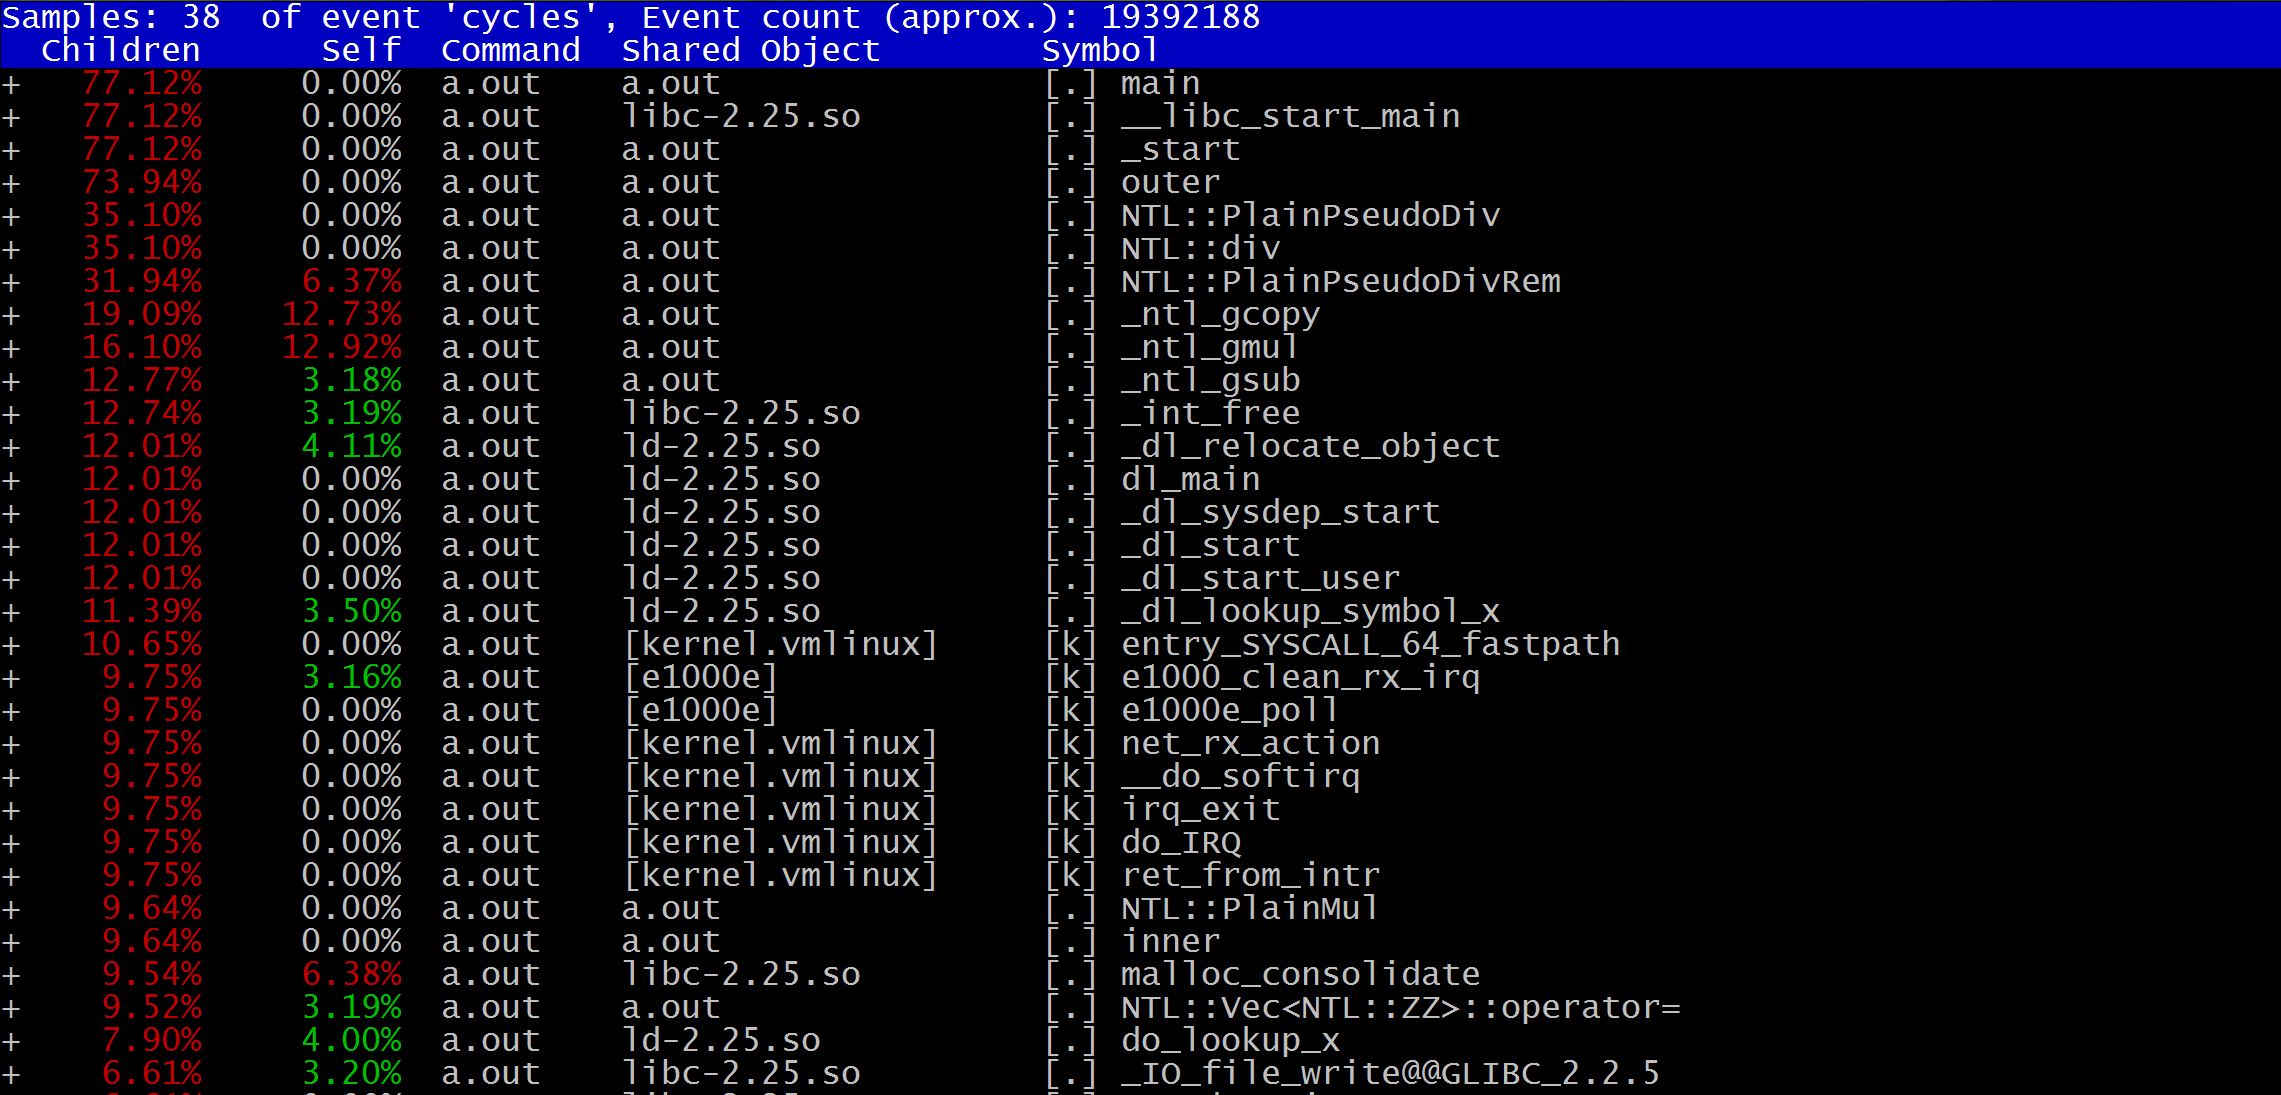
The detailed information of every function will be showed:

Capture

Another awesome tool is FlameGraph which is used to analyze stack call traces:

# git clone --depth 1 https://github.com/brendangregg/FlameGraph
# cd FlameGraph

Copy perf.data into current directory:

# cp ../perf.data ./

Execute following command:

# perf script | ./stackcollapse-perf.pl |./flamegraph.pl > perf.svg

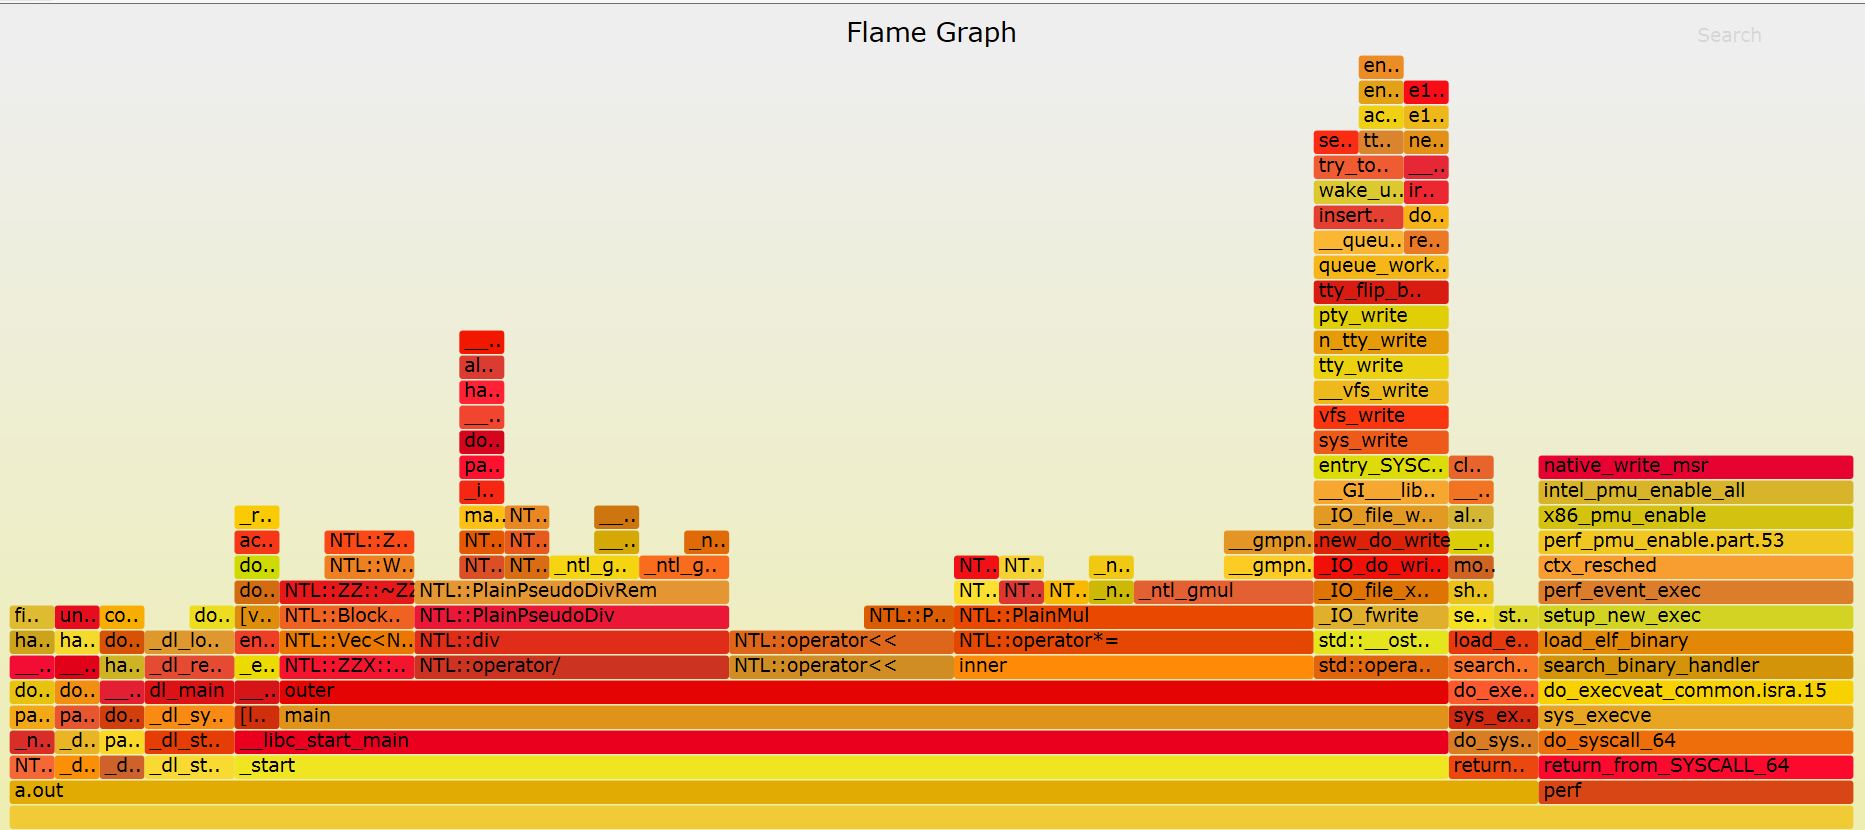
The perf.svg is like this:

FlameGraph

You can see the whole stack frameworks and functions’ consume time ratio.

P.S., the full code is here.

Use “.cu” as file extension name when playing Thrust

Today, I tried the simple Thrust program:

$ cat a.c
#include <thrust/host_vector.h>
#include <thrust/device_vector.h>
#include <iostream>

int main(void) {
        // H has storage for 4 integers
        thrust::host_vector<int> H(4);

        // initialize individual elements
        H[0] = 14;
        H[1] = 20;
        H[2] = 38;
        H[3] = 46;

        // H.size() returns the size of vector H
        std::cout << "H has size " << H.size() << std::endl;

        // print contents of H
        for(int i = 0; i < H.size(); i++)
                std::cout << "H[" << i << "] = " << H[i] << std::endl;

        // resize H
        H.resize(2);
        std::cout << "H now has size " << H.size() << std::endl;

        // Copy host_vector H to device_vector D
        thrust::device_vector<int> D = H;

        // elements of D can be modified
        D[0] = 99;
        D[1] = 88;

        // print contents of D
        for(int i = 0; i < D.size(); i++)
                std::cout << "D[" << i << "] = " << D[i] << std::endl;

        // H and D are automatically deleted when the function returns
        return 0;
}

Built it:

$ nvcc -arch=sm_37 a.c
In file included from a.c:1:0:
/opt/cuda/bin/..//include/thrust/host_vector.h:25:18: fatal error: memory: No such file or directory
compilation terminated.

It seemed very weird! After scanning Thrust’s FAQ, I came across the following tip:

Make sure that files that #include Thrust have a .cu extension. Other extensions (e.g., .cpp) will cause nvcc to treat the file incorrectly and produce an error message.

Renamed the source file name and rebuilt it:

$ mv a.c a.cu
$ nvcc -arch=sm_37 a.cu
$ ./a.out
H has size 4
H[0] = 14
H[1] = 20
H[2] = 38
H[3] = 46
H now has size 2
D[0] = 99
D[1] = 88

Worked like a charm!

Use Source Insight as the editor to develop Unix softwares

Source Insight is my favorite editor, and I have used it for more than 10 years. But when employing it to develop Unix software, you will run into annoying line break issue, which is on windows, the newline is \r\n while in Unix it is \n only. Therefore you will see the file edited in Source Insight will display an extra ^M in Unix environment:

#include <stdio.h>^M
^M
int main(void)^M
{^M
        printf("\r\n");^M
}^M

To resolve this problem, you can refer this topic in stackoverflow:

To save a file with a specific end-of-line type in Source Insight, select File -> Save As…, then where it says “Save as type”, select the desired end-of-line type.

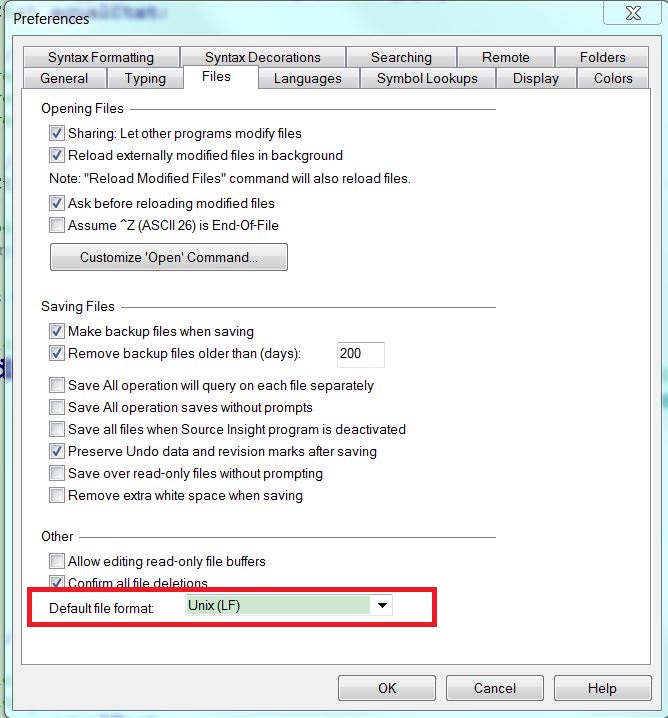
To set the end-of-line type for new files you create in Source Insight, select Options -> Preferences and click the Files tab. Where it says “Default file format” select the desired end-of-line type.

So you can set Unix file format as you wanted:

Capture

Another caveat you should pay attention is if you use git Windows client, by default, it will convert the newline of project from \n to \r\n directly. My solution is just disabling this auto conversion feature:

git config --global core.autocrlf false