The first gcc bug I ever meet

I have used gcc for more than 10 years, but never met a bug before. In my mind, the gcc is one of the stable software in the world, but at yesterday, the myth ended.

I tried to use OpenMP to optimize my program, and all was OK until the taskloop construct was added:

#pragma omp taskloop

The build flow terminated with the following errors:

xxxxxxx.cpp:142:1: internal compiler error: Segmentation fault
 }
 ^
Please submit a full bug report,
with preprocessed source if appropriate.
See <https://bugs.archlinux.org/> for instructions.

Whoops! It seemed I got the lucky draw! Since my project uses a lot of compile options:

... -g -O2 -fopenmp -fprofile-arcs -ftest-coverage ...

I must narrow down to find the root cause. Firstly, I only use -fopenmp, then everything was OK; Secondly, adding -g -O2, no problem; …. After combination trial, -fopenmp -fprofile-arcs can cause the problem.

To confirm it, I wrote a simple program:

int main(void) {
    #pragma omp taskloop
    for (int i = 0; i < 2; i++) {
    }
    return 0;
}

Compile it:

# gcc -fopenmp -fprofile-arcs parallel.c
parallel.c:6:1: internal compiler error: Segmentation fault
 }
 ^
Please submit a full bug report,
with preprocessed source if appropriate.
See <https://bugs.archlinux.org/> for instructions.

Yeah, the bug was reproduced! It verified my assumption.

To bypass this issue, I decided to try the newest gcc. My OS is ArchLinux,and the gcc version is 6.3.1:

# gcc -v
Using built-in specs.
COLLECT_GCC=gcc
COLLECT_LTO_WRAPPER=/usr/lib/gcc/x86_64-pc-linux-gnu/6.3.1/lto-wrapper
Target: x86_64-pc-linux-gnu
Configured with: /build/gcc/src/gcc/configure --prefix=/usr --libdir=/usr/lib --libexecdir=/usr/lib --mandir=/usr/share/man --infodir=/usr/share/info --with-bugurl=https://bugs.archlinux.org/ --enable-languages=c,c++,ada,fortran,go,lto,objc,obj-c++ --enable-shared --enable-threads=posix --enable-libmpx --with-system-zlib --with-isl --enable-__cxa_atexit --disable-libunwind-exceptions --enable-clocale=gnu --disable-libstdcxx-pch --disable-libssp --enable-gnu-unique-object --enable-linker-build-id --enable-lto --enable-plugin --enable-install-libiberty --with-linker-hash-style=gnu --enable-gnu-indirect-function --disable-multilib --disable-werror --enable-checking=release
Thread model: posix
gcc version 6.3.1 20170306 (GCC)

Now ArchLinux doesn’t provide gcc 7.1 installation package, so I need to download and build it myself:

# wget http://gcc.parentingamerica.com/releases/gcc-7.1.0/gcc-7.1.0.tar.gz
# tar xvf gcc-7.1.0.tar.gz
# cd gcc-7.1.0/
# mkdir build
# cd build

Select the configuration options is a headache task for me, and I decide to copy the current options for 6.3.1 (Please refer the above output from gcc -v):

# ../configure --prefix=/usr --libdir=/usr/lib --libexecdir=/usr/lib --mandir=/usr/share/man --infodir=/usr/share/info .....

Since I don’t need to compile ada and lto, I remove these from --enable-languages:

--enable-languages=c,c++,fortran,go,objc,obj-c++

Besides this, I also need to build and install isl library myself or through ArchLinux isl package. Once configuration is successful, I can build and install it:

# make
# make install

Check the newest gcc:

# gcc -v
Using built-in specs.
COLLECT_GCC=gcc
COLLECT_LTO_WRAPPER=/usr/lib/gcc/x86_64-pc-linux-gnu/7.1.0/lto-wrapper
Target: x86_64-pc-linux-gnu
Configured with: ../configure --prefix=/usr --libdir=/usr/lib --libexecdir=/usr/lib --mandir=/usr/share/man --infodir=/usr/share/info --with-bugurl=https://bugs.archlinux.org/ --enable-languages=c,c++,fortran,go,objc,obj-c++ --enable-shared --enable-threads=posix --enable-libmpx --with-system-zlib --with-isl --enable-__cxa_atexit --disable-libunwind-exceptions --enable-clocale=gnu --disable-libstdcxx-pch --disable-libssp --enable-gnu-unique-object --enable-linker-build-id --enable-lto --enable-plugin --enable-install-libiberty --with-linker-hash-style=gnu --enable-gnu-indirect-function --disable-multilib --disable-werror --enable-checking=release
Thread model: posix
gcc version 7.1.0 (GCC)

Compile the program again:

# gcc -fopenmp -fprofile-arcs parallel.c
#

This time compilation is successful!

P.S. The gcc may have other bugs when supporting some new OpenMP directives, so please pay attention to it.
Use perf and FlameGraph to profile program on Linux

In most Linux environments, the perf tools should be set up by default. Otherwise, you can install it manually. E.g., in ArchLinux:

# pacman -S perf

Use following program as an example (It is a rifacimento from here, and you should only focus on the framework of the code):

# cat test.cpp
#include <NTL/ZZX.h>

using namespace std;
using namespace NTL;

void inner(int i, ZZX& t, Vec<ZZX>& phi)
{
        for (long j = 1; j <= i-1; j++)
         if (i % j == 0)
            t *= phi(j);
}

void outer(int i, Vec<ZZX>& phi)
{
        ZZX t;
        t = 1;
        inner(i, t, phi);
        phi(i) = (ZZX(INIT_MONO, i) - 1)/t;
        cout << phi(i) << "\n";
}

int main()
{
   Vec<ZZX> phi(INIT_SIZE, 100);

   for (long i = 1; i <= phi.length(); i++) {
      outer(i, phi);
   }
}

Compile it:

# g++ -g -O2 -pthread test.cpp -lntl -lgmp

It is suggested that using -g -O2 options since -g can provide debug information which perf needs and -O2 can generate lots of optimizations.

Use perf record to sample the program:

# perf record --call-graph dwarf ./a.out
......
[ perf record: Woken up 2 times to write data ]
[ perf record: Captured and wrote 0.318 MB perf.data (38 samples) ]

To profile an already running program, use -p pid flag. A perf.data file will be generated in current directory, and you can use perf report command to parse it:

# perf report

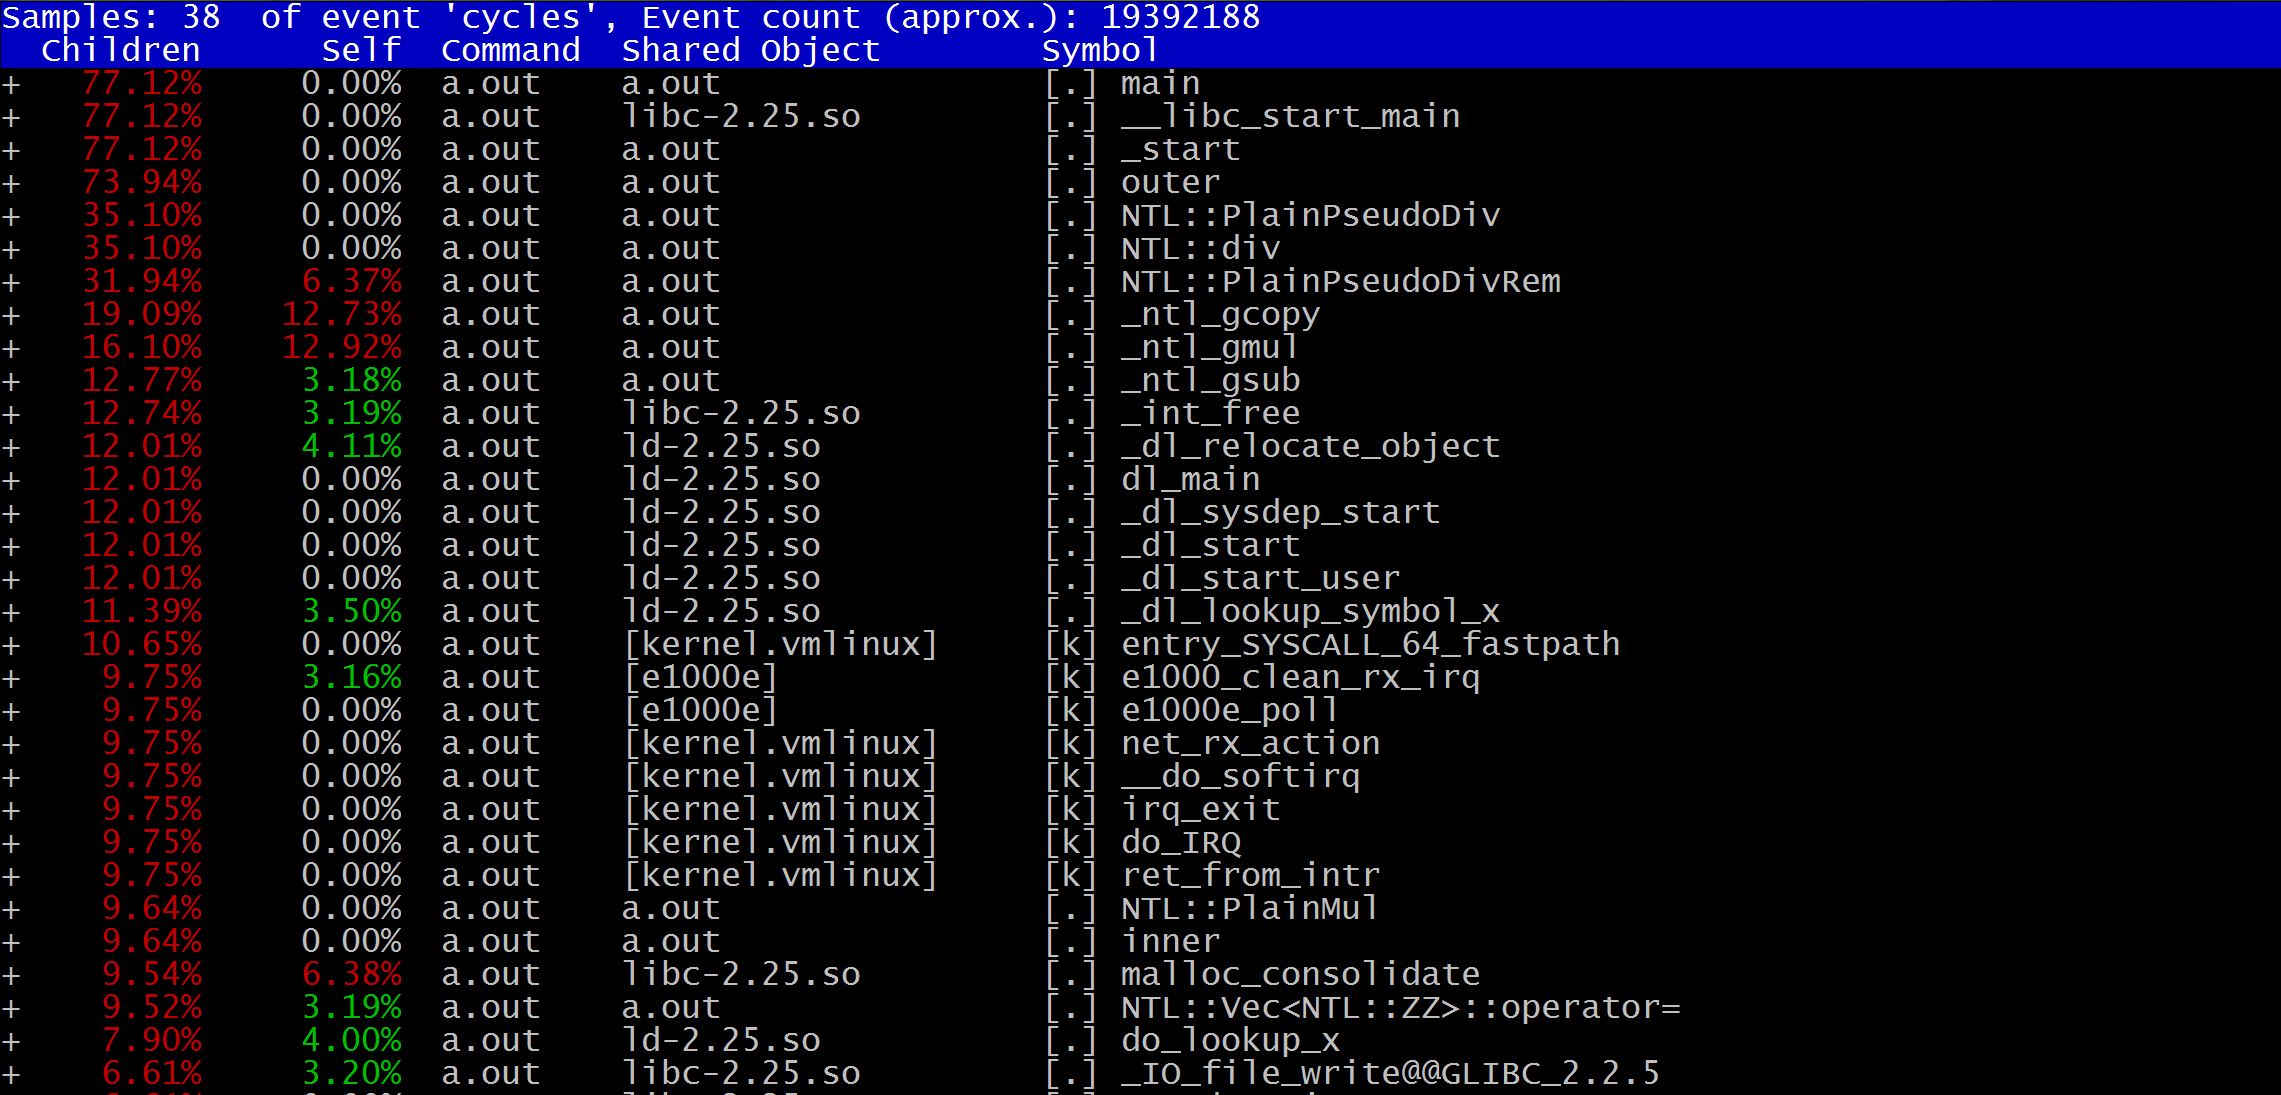
The detailed information of every function will be showed:

Capture

Another awesome tool is FlameGraph which is used to analyze stack call traces:

# git clone --depth 1 https://github.com/brendangregg/FlameGraph
# cd FlameGraph

Copy perf.data into current directory:

# cp ../perf.data ./

Execute following command:

# perf script | ./stackcollapse-perf.pl |./flamegraph.pl > perf.svg

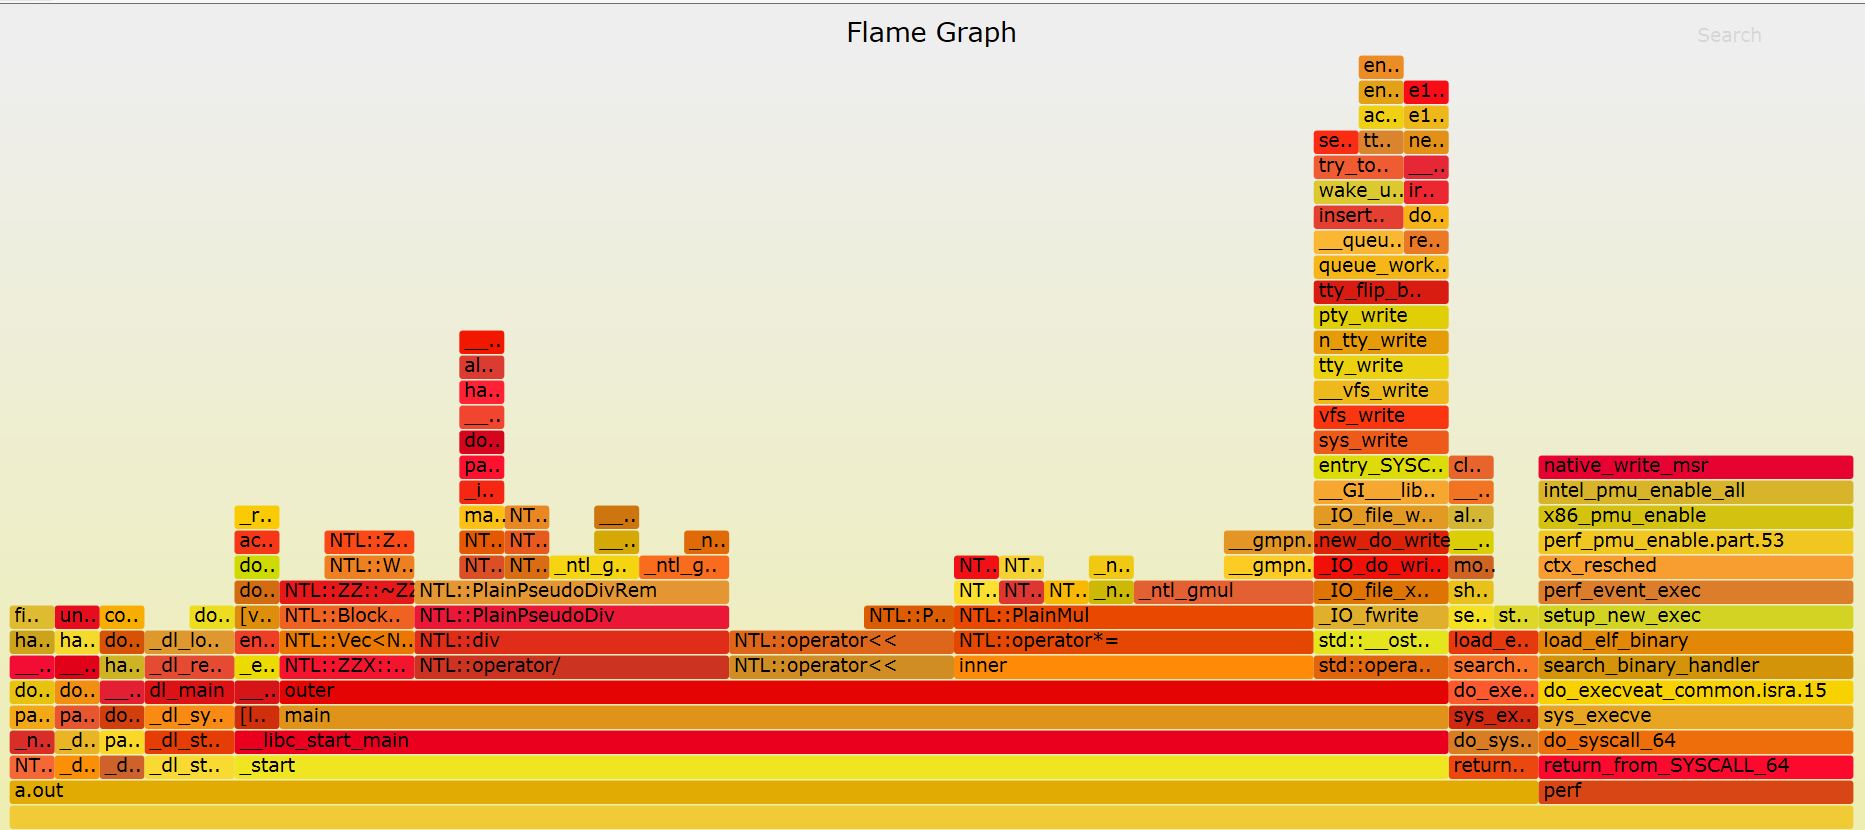
The perf.svg is like this:

FlameGraph

You can see the whole stack frameworks and functions’ consume time ratio.

P.S., the full code is here.

Why doesn’t “~ /.profile” take effect in Arch Linux?

I followed Rust tutorial to install Rust on my Arch Linux, and found the Rust directory is indeed added into ~/.profile file:

$ cat ~/.profile

export PATH="$HOME/.cargo/bin:$PATH"

But after re-login, I couldn’t see Rust folder is in $PATH variable:

$ echo $PATH
/usr/local/sbin:/usr/local/bin:/usr/bin:/opt/cuda/bin:/usr/lib/jvm/default/bin:/usr/bin/site_perl:/usr/bin/vendor_perl:/usr/bin/core_perl

It didn’t take effect!

After reading Arch Linux Bash document, I noticed the following statement which describes ~/.bash_profile:

If this file does not exist, ~/.bash_login and ~/.profile are checked in that order.

So this means that if ~/.bash_profile exists,~/.bash_login and ~/.profile won’t be checked, right? Let’s do a check:

(1) Use strace command to record the files’ names related to current user when logining.

$ strace -o out -e open bash -l
$ grep "/home/xiaonan" out
open("/home/xiaonan/.bash_profile", O_RDONLY) = 3
open("/home/xiaonan/.bashrc", O_RDONLY) = 3
open("/home/xiaonan/.bash_history", O_RDONLY) = 3
$ exit
logout

As expected, the ~/.profile, i.e., /home/xiaonan/.profile wasn’t opened.

(2) Renamed ~/.bash_profile to pretend it didn’t exist, checked whether ~/.profile would be read:

$ mv .bash_profile .bash_profile.bak
$ strace -o out -e open bash -l
$ grep "/home/xiaonan" out
open("/home/xiaonan/.bash_profile", O_RDONLY) = -1 ENOENT (No such file or directory)
open("/home/xiaonan/.bash_login", O_RDONLY) = -1 ENOENT (No such file or directory)
open("/home/xiaonan/.profile", O_RDONLY) = 3
open("/home/xiaonan/.bash_history", O_RDONLY) = 3
$ echo $PATH
/home/xiaonan/.cargo/bin:/usr/local/sbin:/usr/local/bin:/usr/bin:/opt/cuda/bin:/usr/lib/jvm/default/bin:/usr/bin/site_perl:/usr/bin/vendor_perl:/usr/bin/core_perl
$ exit
logout

As things turned out, when the ~/.bash_profile didn’t exist:

open("/home/xiaonan/.bash_profile", O_RDONLY) = -1 ENOENT (No such file or directory)

The bash would access ~/.bash_login and ~/.profile in sequence, and $HOME/.cargo/bin was added into $PATH finally.

The solution of this issue is adding following statement in ~/.bash_profile:

[[ -f ~/.profile ]] && . ~/.profile

Now it works!

The core dump file in Arch Linux

Arch Linux uses systemd, and the core dump files will be stored in /var/lib/systemd/coredump directory by default.

Let’s look at the following simple program:

int main(void) {
        int *p = 0;
        *p = 1;
}

Compile and run it:

$ gcc -g -o test test.c
$ ./test
Segmentation fault (core dumped)

Definitely, the program crashes! Check the core dump files:

$ coredumpctl list
TIME                            PID   UID   GID SIG COREFILE EXE
......
Mon 2017-01-09 16:13:44 SGT    7307  1014  1014  11 present  /home/xiaonan/test
$ ls -alt /var/lib/systemd/coredump/core.test*
-rw-r-----+ 1 root root     22821 Jan  9 16:13 /var/lib/systemd/coredump/core.test.1014.183b4c57ccad464abd2eba2c104a47a8.7307.1483949624000000000000.lz4

According to the file name and time, we can find the program’s corresponding core dump binary. To debug it, we can use “coredumpctl gdb PID” command:

$ coredumpctl gdb 7307
       PID: 7307 (test)
       UID: 1014 (xiaonan)
       GID: 1014 (xiaonan)
    Signal: 11 (SEGV)
 Timestamp: Mon 2017-01-09 16:13:44 SGT (6min ago)
Command Line: ./test
Executable: /home/xiaonan/test
 Control Group: /user.slice/user-1014.slice/session-c4.scope
          Unit: session-c4.scope
         Slice: user-1014.slice
       Session: c4
     Owner UID: 1014 (xiaonan)
       Boot ID: 183b4c57ccad464abd2eba2c104a47a8
    Machine ID: 25671e5feadb4ae4bbe2c9ee6de97d66
      Hostname: supermicro-sys-1028gq-trt
       Storage: /var/lib/systemd/coredump/core.test.1014.183b4c57ccad464abd2eba2c104a47a8.7307.1483949624000000000000.lz4
       Message: Process 7307 (test) of user 1014 dumped core.

            Stack trace of thread 7307:
            #0  0x00000000004004b6 main (test)
            #1  0x00007f67ba722291 __libc_start_main (libc.so.6)
            #2  0x00000000004003da _start (test)

GNU gdb (GDB) 7.12
Copyright (C) 2016 Free Software Foundation, Inc.
License GPLv3+: GNU GPL version 3 or later <http://gnu.org/licenses/gpl.html>
This is free software: you are free to change and redistribute it.
There is NO WARRANTY, to the extent permitted by law.  Type "show copying"
and "show warranty" for details.
This GDB was configured as "x86_64-pc-linux-gnu".
Type "show configuration" for configuration details.
For bug reporting instructions, please see:
<http://www.gnu.org/software/gdb/bugs/>.
Find the GDB manual and other documentation resources online at:
<http://www.gnu.org/software/gdb/documentation/>.
For help, type "help".
Type "apropos word" to search for commands related to "word"...
Reading symbols from /home/xiaonan/test...done.
[New LWP 7307]
Core was generated by `./test'.
Program terminated with signal SIGSEGV, Segmentation fault.
#0  0x00000000004004b6 in main () at test.c:3
3               *p = 1;
(gdb) bt
#0  0x00000000004004b6 in main () at test.c:3

BTW, if you omit PID, “coredumpctl gdb” will launch the newest core dump file.

Attention should be paid. The core dump size is limited to 2GiB, so if it is too large, it will be truncated, and generate the warning like this (Please refer this bug):

......
BFD: Warning: /var/tmp/coredump-ZrhAM4 is truncated: expected core file size >= 2591764480, found: 2147483648.
......

References:
GDB and trouble with core dumps;
Core dump.