Invoke profile function in Nsight

When using Nsight to develop CUDA program, you can use profile function to profile the program:

1

You can also toggle the C/C++ and profile view in the right corner:

2

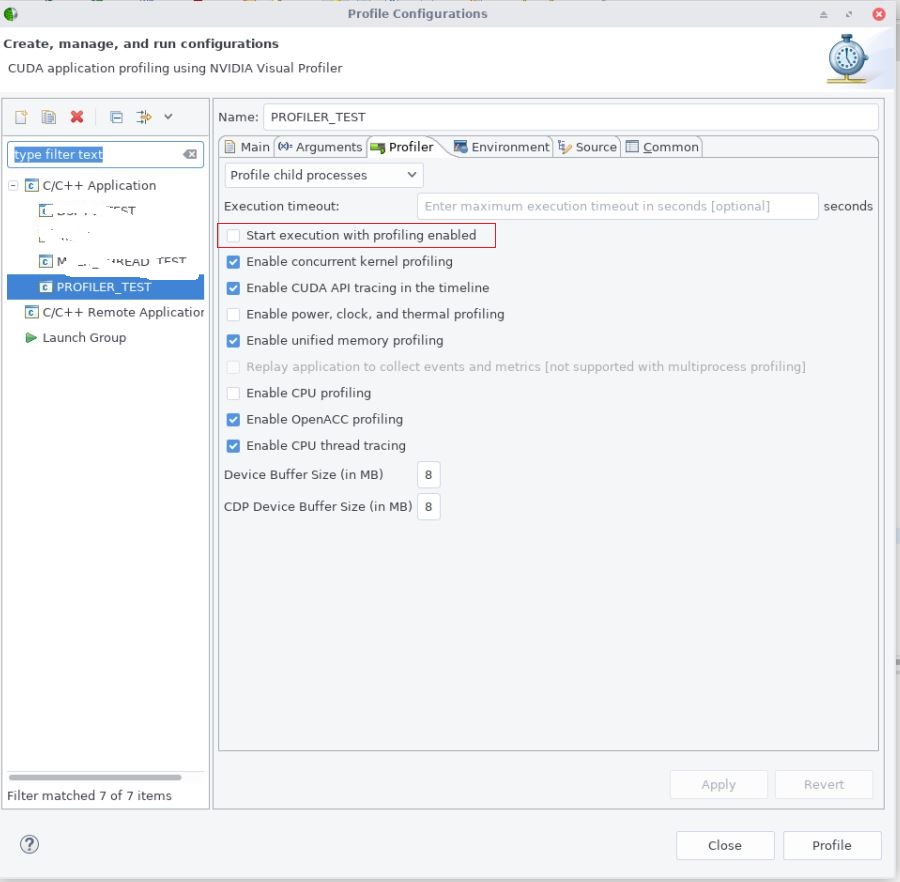
BTW, if you only want to profile a part of the program (not the whole), you can usecudaProfilerStart() and cudaProfilerStop to surround the code, then untick “Start execution with profiling enabled” in “Profile Configuration“:

Import existing CUDA project into Nsight

The steps to import an existing CUDA project (who uses CMake) into Nsight are as following:

(1) Select File -> New -> CUDA C/C++ Project:

1

Untick “Use default location“, and select the root directory of your project.

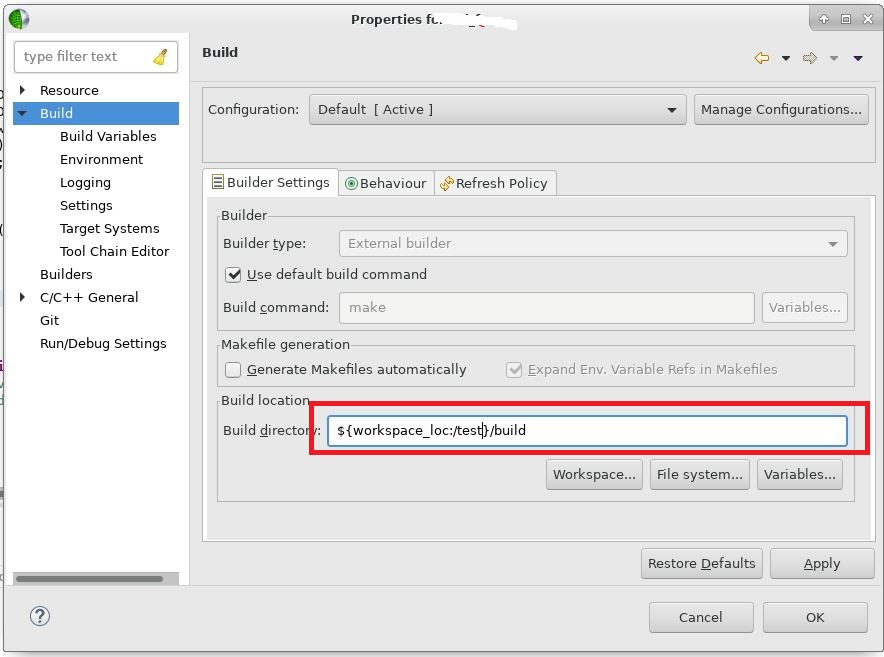
(2) Change Build location in Properties to points to the Makefile position.

2

(3) After building successfully, right click project: Run As -> Local C/C++ Application, then select which binary you want to execute.

References:
Setting Nsight to run with existing Makefile project;
How to create Eclipse project from CMake project;
How to change make location in Eclipse.


Some tips of using “pool” in programming

In the past weeks, I am dived into utilizing CUDA APIs to operate on multiple GPUs. Among my work, one is a “memory pool” module which manages allocating/freeing memories from different devices. In this post, I want to share some thoughts about “pool”, an interesting tech in programming.

The “pool” works like a “cache”: it allocates some resource beforehand; if the application wants it, the “pool” picks up a available one for it. One classical example is the “database connection pool”: the “pool” preallocates some TCP connections and keep them alive, and this will save client from handshaking with server every time. The other instance is “memory pool”, which I implemented recently. The “pool” keeps the freed memory, and not really release it to device. Based on my benchmark test, the application’s performance can get a 100% improvement in extreme case. (Caveat: For multithreaded application, if the locking mechanism of “pool” becomes the performance bottleneck, try every thread has its own private “pool”.)

The other function of using “pool” is for debugging purpose. Still use my “memory pool” as an demonstration: for every memory pointer, there are a device ID (which GPU this memory is allocated from) and memory size accompanied with it. So you can know the whole life of this block memory clearly from analyzing trace log. This has saved me from notorious “an illegal memory access was encountered” error many times in multiple GPU programming.

Last but not least, although the number of this “memory pool”‘s code lines is merely ~100, I already use following data structures: queue, vector, pair and map. Not mention the mutex and lock, which are essential to avoid nasty data-race issues. So writing this model is a good practice to hone my programming craft.

Enjoy coding!

An empirical method of debugging “illegal memory access” bug in CUDA programming

Recently, I encountered “an illegal memory access was encountered” error during CUDA programming. such as:

cudaSafeCall(cudaMemcpy(h_res, d_res, gParams.n*sizeof(uint32), cudaMemcpyDeviceToHost));

Because the kernel in CUDA programming is executed asynchronously, the code which reports error is not the original culprit usually. After referring this piece of code, I encapsulate a new cudaMemoryTest function:

#define cudaSafeCall(call)  \
        do {\
            cudaError_t err = call;\
            if (cudaSuccess != err) \
            {\
                std::cerr << "CUDA error in " << __FILE__ << "(" << __LINE__ << "): " \
                    << cudaGetErrorString(err);\
                exit(EXIT_FAILURE);\
            }\
        } while(0)

void cudaMemoryTest()
{
    const unsigned int N = 1048576;
    const unsigned int bytes = N * sizeof(int);
    int *h_a = (int*)malloc(bytes);
    int *d_a;
    cudaSafeCall(cudaMalloc((int**)&d_a, bytes));

    memset(h_a, 0, bytes);
    cudaSafeCall(cudaMemcpy(d_a, h_a, bytes, cudaMemcpyHostToDevice));
    cudaSafeCall(cudaMemcpy(h_a, d_a, bytes, cudaMemcpyDeviceToHost));

    return 0;
}

And insert this function call to the suspicious positions:

{
    cudaMemoryTest();
    kernel_A<<<...>>>;

    ......

    cudaMemoryTest();
    kernel_B<<<...>>>;

    ......
}

This method can notify me timely once the CUDA memory access is exceptional, then I can investigate further.

Mostly, the reasons causing this issue is NULL pointer or a pointer points to a already freed memory. But in multiple GPUs environment, you must make sure the memory for one operation is allocated in the same device.

nvidia-smi doesn’t display GPU device in order

Today I find nvidia-smi program doesn’t display GPU devices in order:

$ nvidia-smi -L
GPU 0: Tesla P100-PCIE-16GB (UUID: GPU-...)
GPU 1: Tesla P100-PCIE-16GB (UUID: GPU-...)
GPU 2: Tesla P100-PCIE-16GB (UUID: GPU-...)
GPU 3: Tesla V100-PCIE-16GB (UUID: GPU-...)

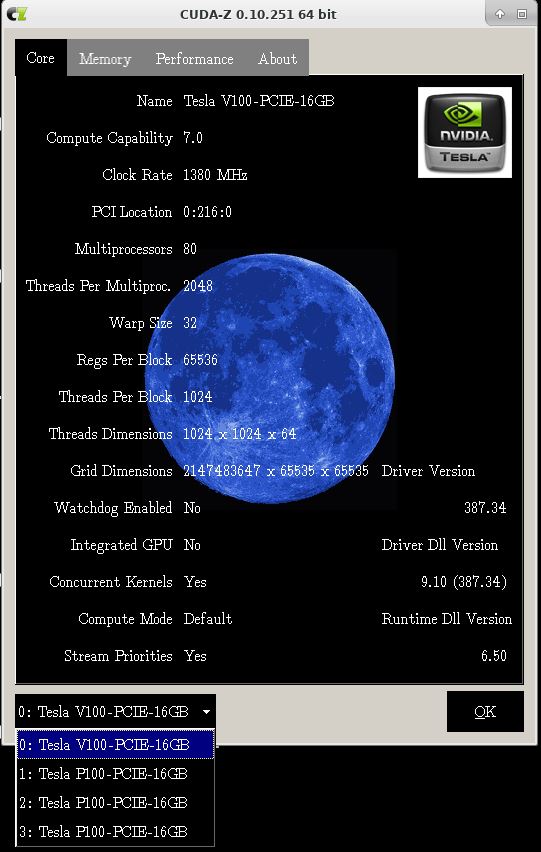
The above output displays V100‘s device ID is 3. While CUDA-Z display V100‘s device ID is 0:

Capture

My own lscuda also display it as the 0th device:

$ ./lscuda
CUDA Runtime Version:             9.1
CUDA Driver Version:              9.1
GPU(s):                           4
GPU Device ID:                    0
  Name:                           Tesla V100-PCIE-16GB
......