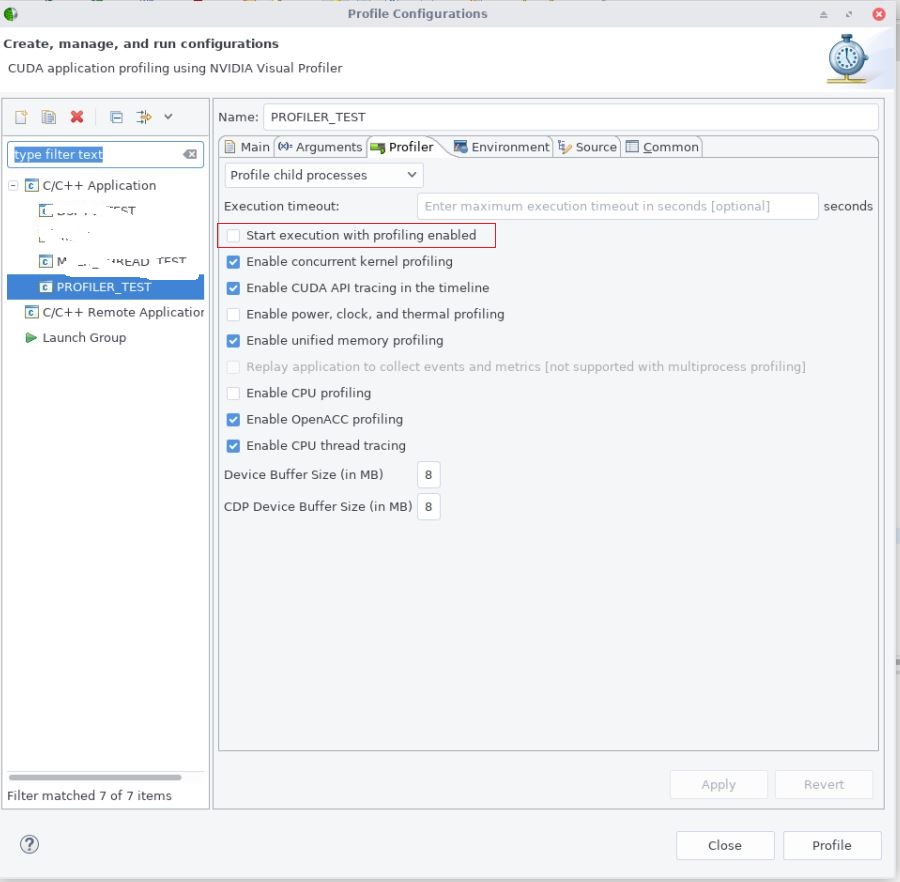
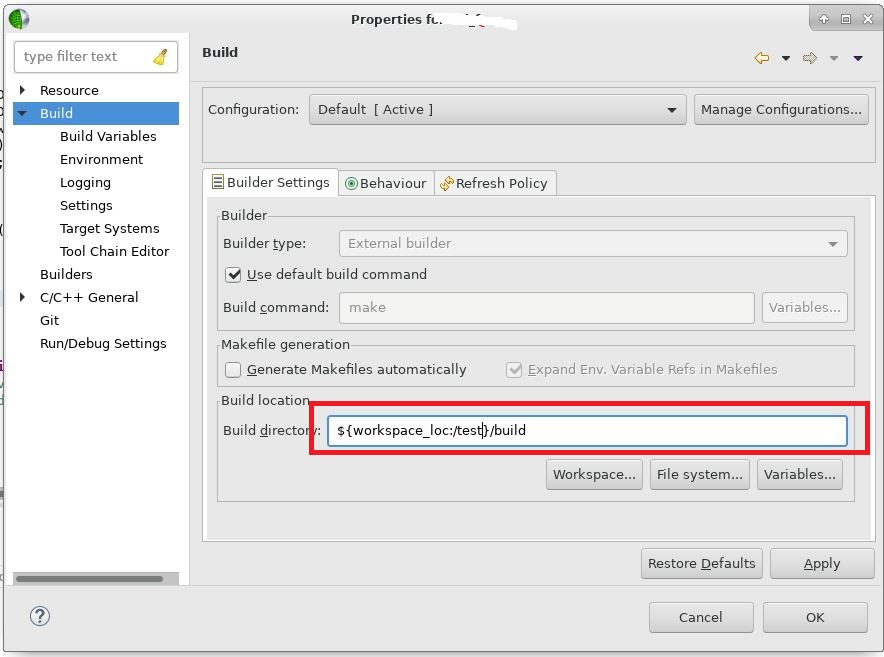
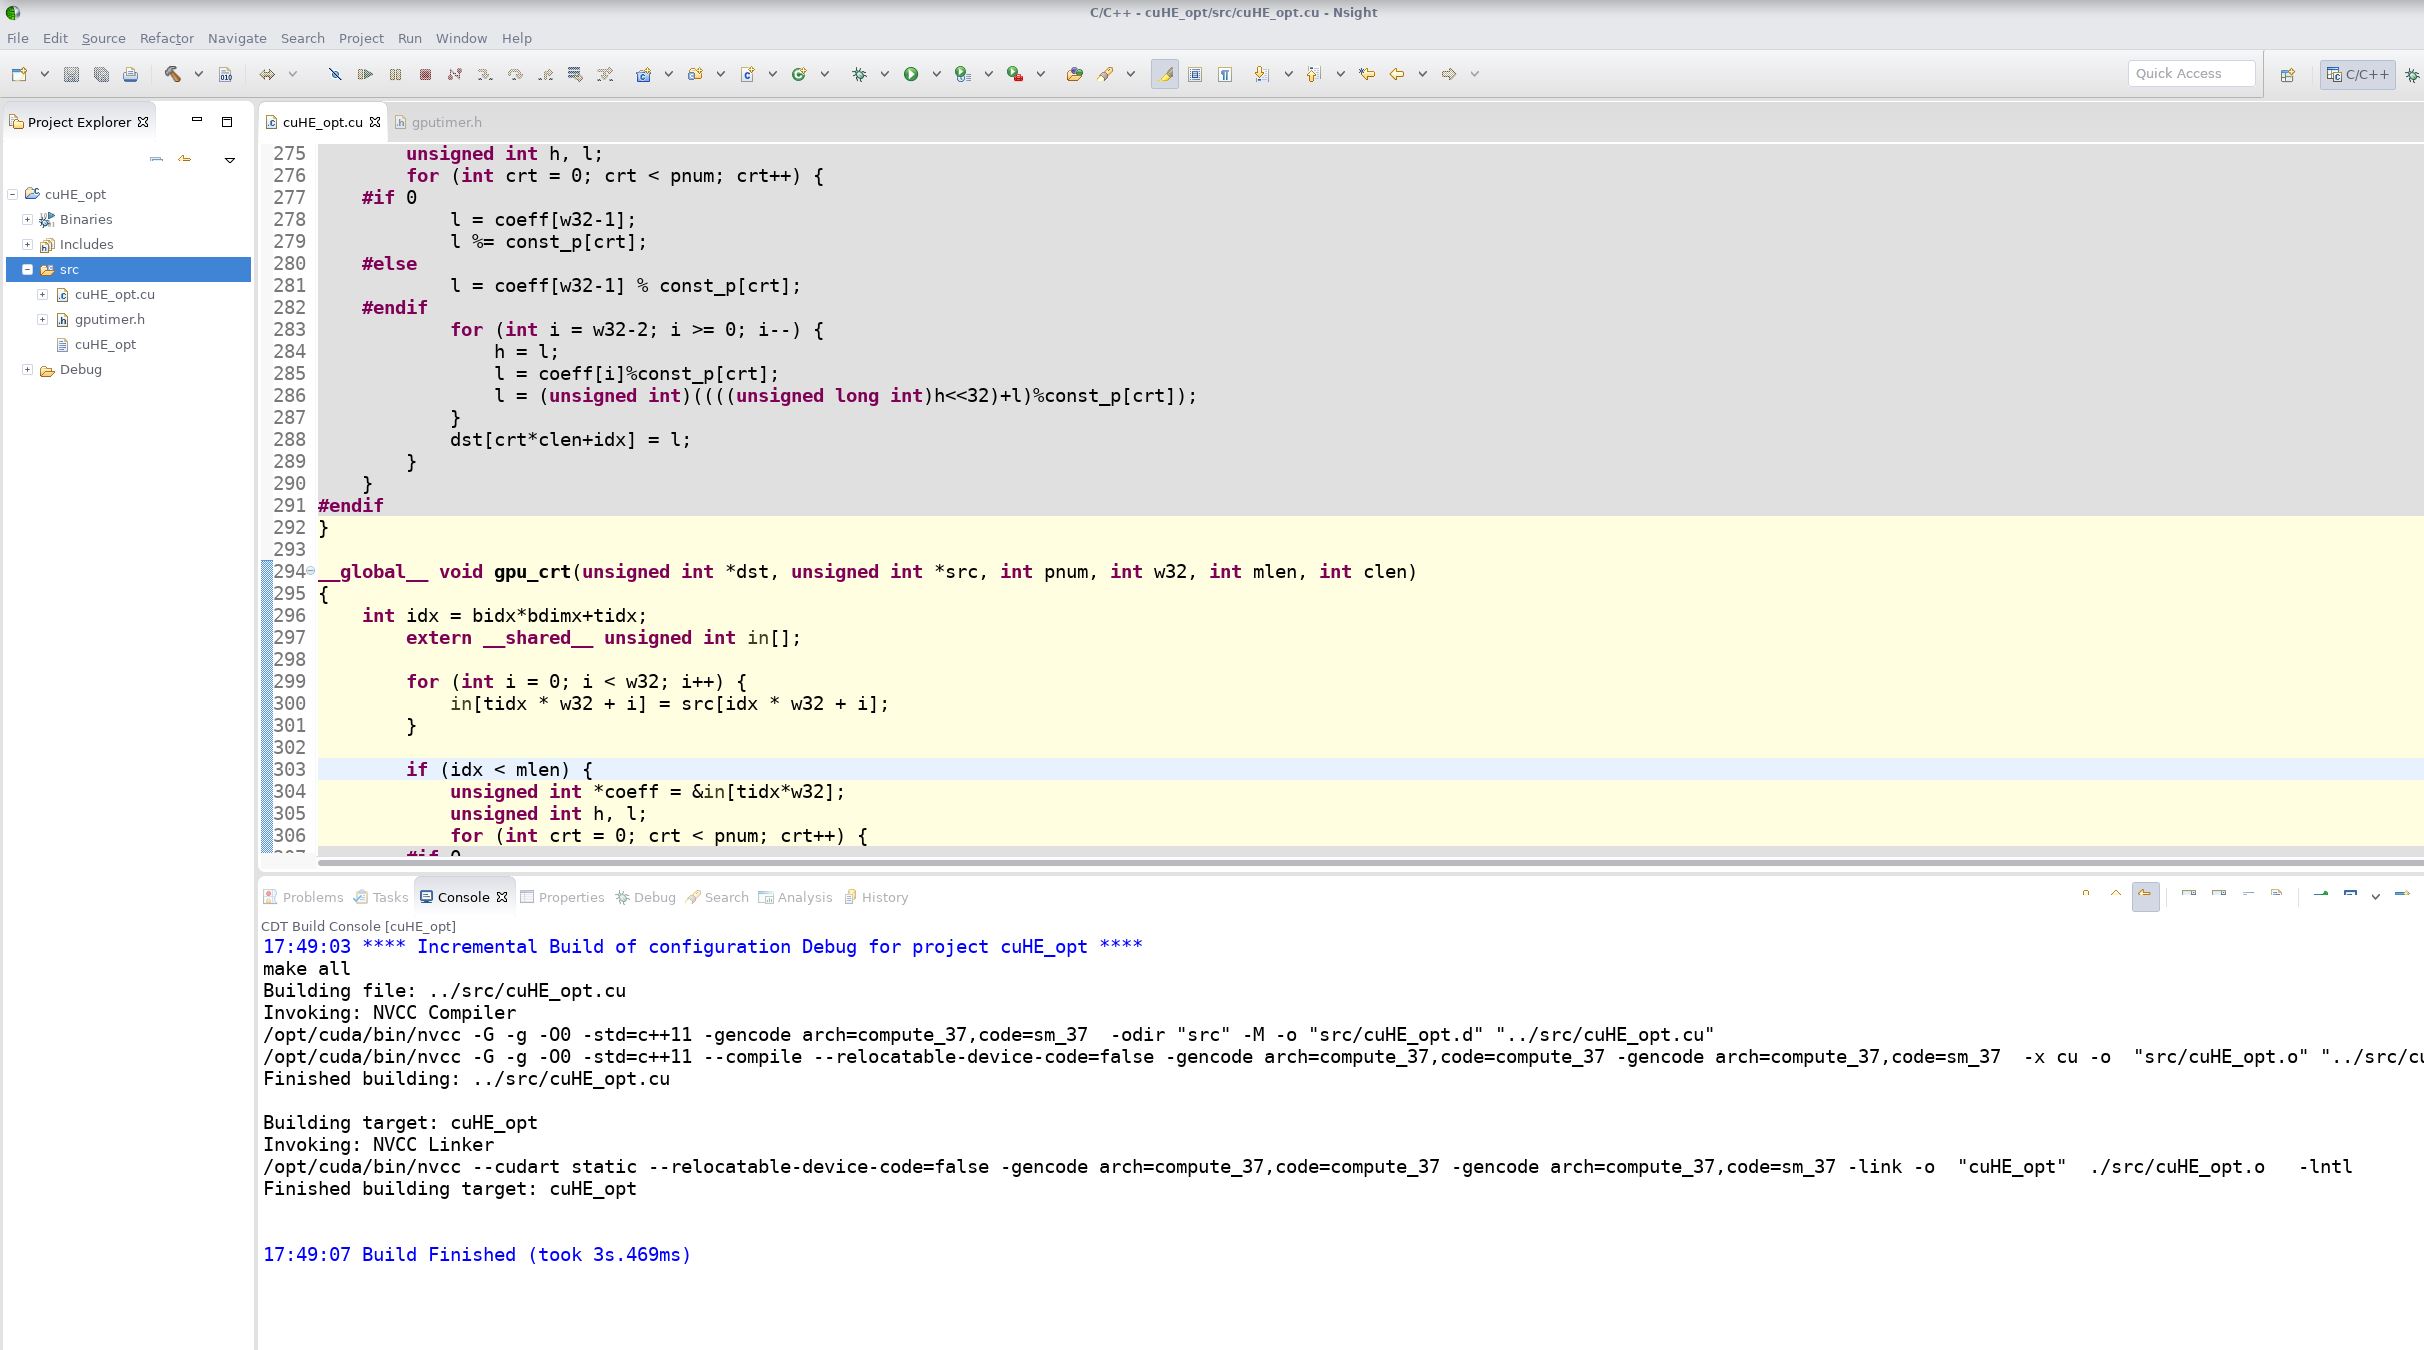
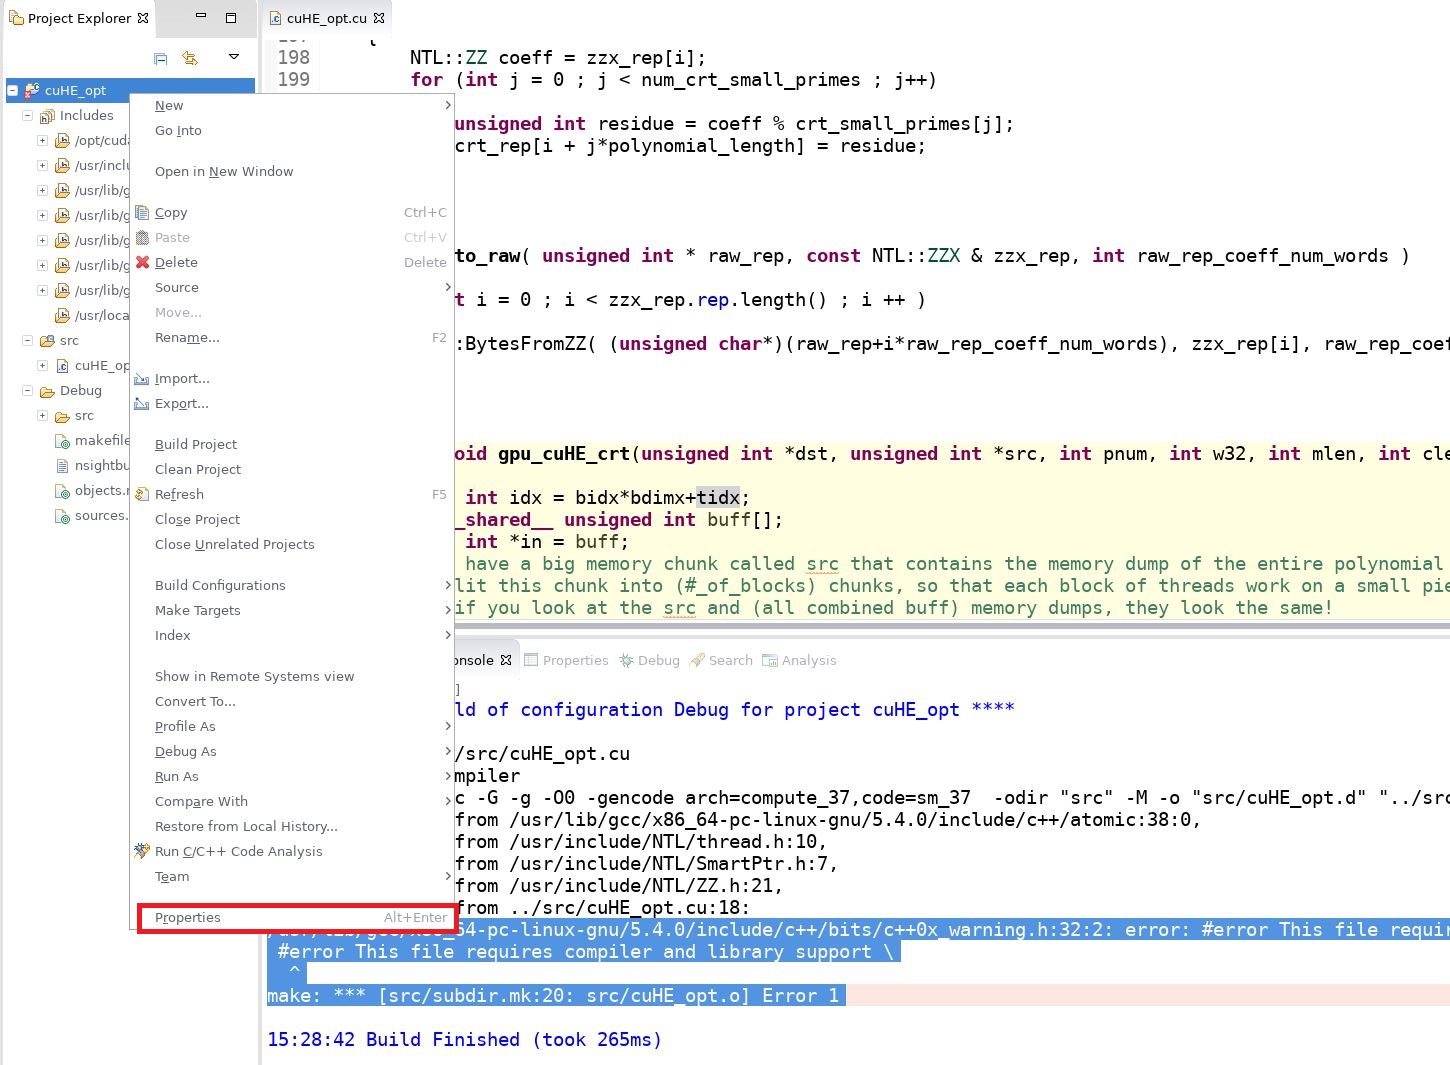
I use Nsight as an IDE to develop CUDA programs:

Use nvprof to measure the load efficiency and store efficiency of accessing global memory:
$ nvprof --devices 2 --metrics gld_efficiency,gst_efficiency ./cuHE_opt

................... CRT polynomial Terminated ...................

==1443== Profiling application: ./cuHE_opt
==1443== Profiling result:
==1443== Metric result:
Invocations   Metric NameMetric Description Min Max Avg
Device "Tesla K80 (2)"
Kernel: gpu_cuHE_crt(unsigned int*, unsigned int*, int, int, int, int)
  1gld_efficiency Global Memory Load Efficiency  62.50%  62.50%  62.50%
  1gst_efficiencyGlobal Memory Store Efficiency 100.00% 100.00% 100.00%
Kernel: gpu_crt(unsigned int*, unsigned int*, int, int, int, int)
  1gld_efficiency Global Memory Load Efficiency  39.77%  39.77%  39.77%
  1gst_efficiencyGlobal Memory Store Efficiency 100.00% 100.00% 100.00%
But if I use nvcc to compile the program directly:
nvcc -arch=sm_37 cuHE_opt.cu -o cuHE_opt
The nvprof displays the different measuring results:
$ nvprof --devices 2 --metrics gld_efficiency,gst_efficiency ./cuHE_opt
......
................... CRT polynomial Terminated ...................

==1801== Profiling application: ./cuHE_opt
==1801== Profiling result:
==1801== Metric result:
Invocations   Metric NameMetric Description Min Max Avg
Device "Tesla K80 (2)"
Kernel: gpu_cuHE_crt(unsigned int*, unsigned int*, int, int, int, int)
  1gld_efficiency Global Memory Load Efficiency 100.00% 100.00% 100.00%
  1gst_efficiencyGlobal Memory Store Efficiency 100.00% 100.00% 100.00%
Kernel: gpu_crt(unsigned int*, unsigned int*, int, int, int, int)
  1gld_efficiency Global Memory Load Efficiency  50.00%  50.00%  50.00%
  1gst_efficiencyGlobal Memory Store Efficiency 100.00% 100.00% 100.00%
After some investigations, the reason is using -G compile option in the first case. As the document of nvcc has mentioned:
--device-debug (-G)
    Generate debug information for device code. Turns off all optimizations.
    Don't use for profiling; use -lineinfo instead.
So don’t use -G compile option for profiling CUDA programs.


