Yesterday I met a performance issue: the consumer threads’ CPU utilisation are nearly 100%. From the perf report, these consumer threads spent remarkable time in searching from the hash tables. Since every consumer thread has its own hash table, we don’t need to worry about lock-contention issue, but the buckets number of the hash table is not large enough, so every bucket holds too many elements, and searching from these elements costs a lot of time. The fix is straightforward: increase the number of buckets.
Tag: perf
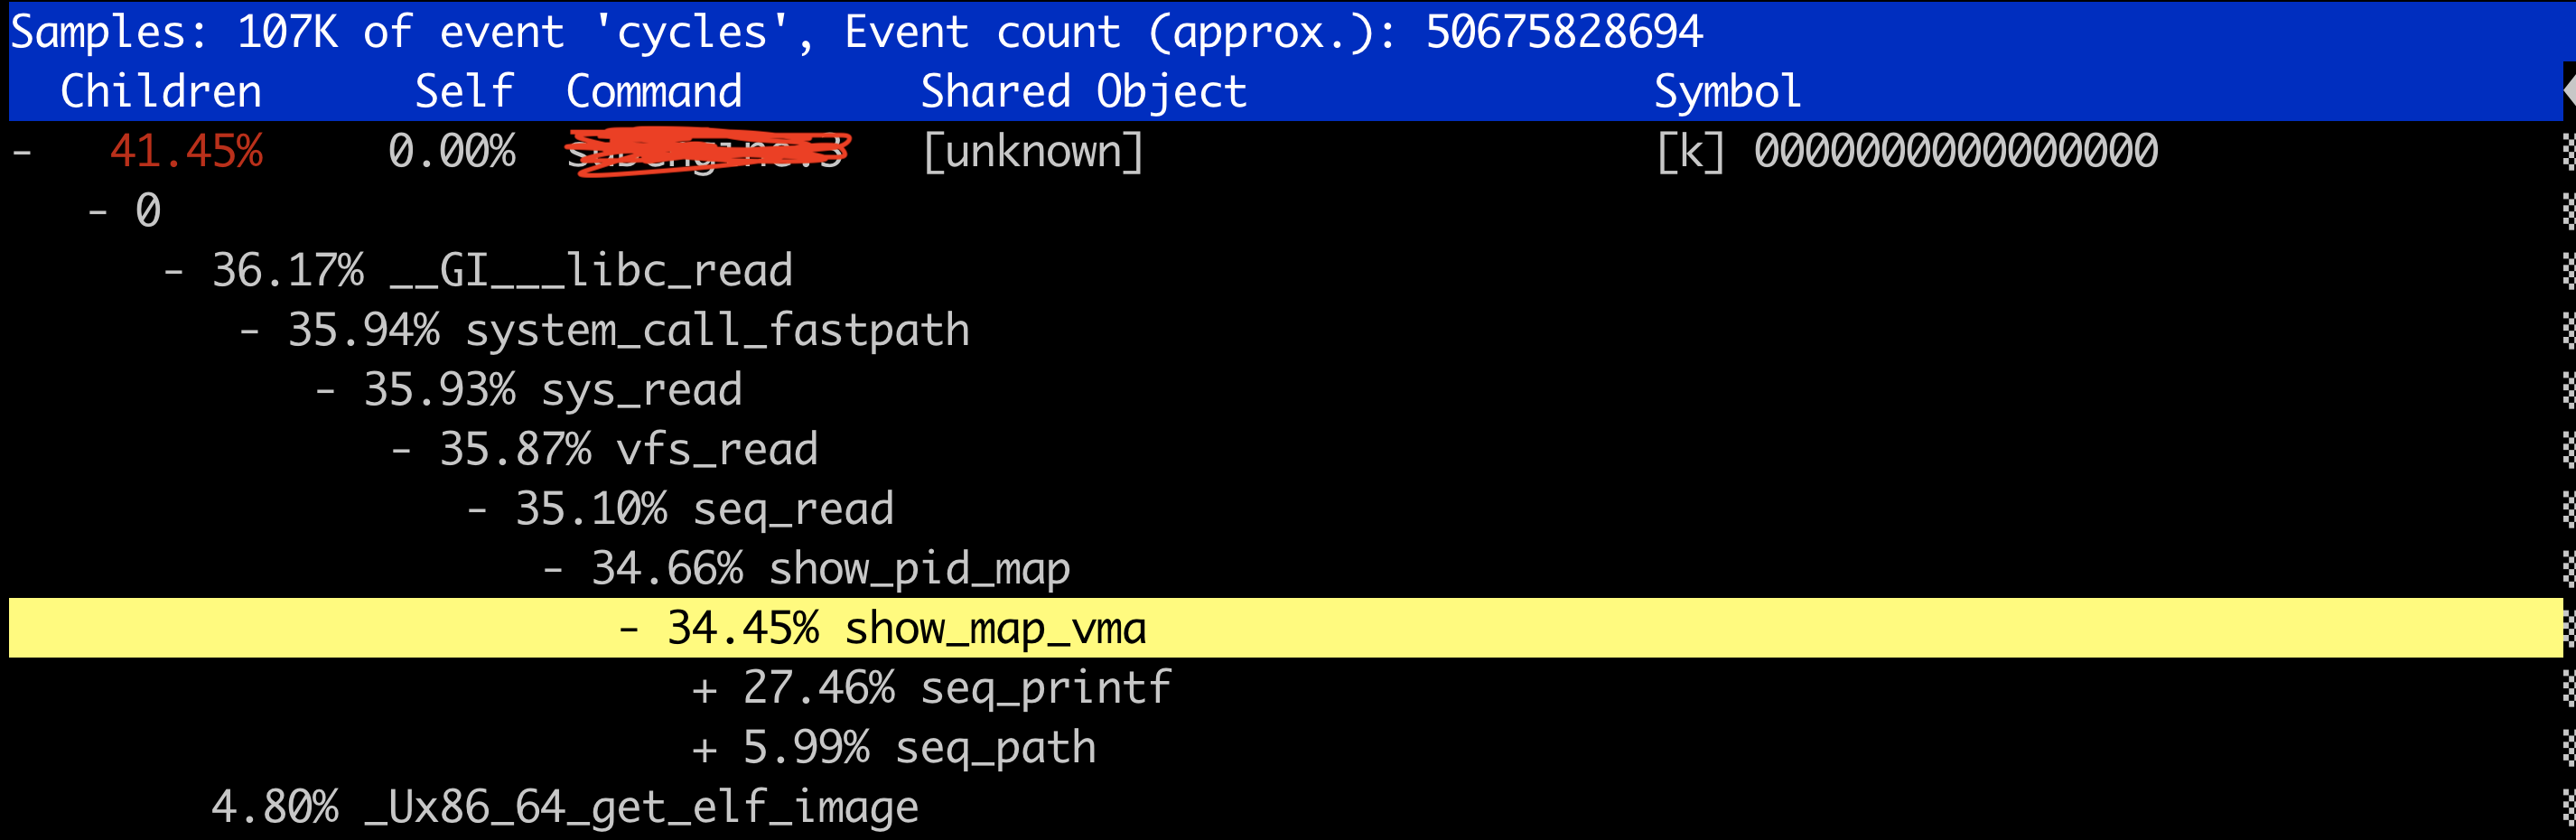
Expand/Collapse callchains shortcut keys for perf-report command
When using perf-report command to analyse the perf.data, to expand current entry callchain, press e:

Press e or c will collapse it.
To expand all callchains, press E, and to collapse all, press C.
The shortcut keys for perf-report command
I am not sure it is only me, but I can’t find any document to introduce the shortcut keys for perf-report command. After executing perf report, press h will show the shortcut keys:

If you want to filter some symbols, press /:

To remove filter, you should press / + ENTER, instead of pressing q/ESC:

Otherwise you will exit perf-report program (Because the filtered symbols screen is actually the main screen when you run perf report):
unw_get_proc_name() can be a performance bottleneck
The doubt about “perf record -p pid sleep 10”
In Brendan Gregg’s awesome perf Examples, there is one command which can be used to sample for assigned time, e.g., 10 seconds:
# Sample on-CPU functions for the specified PID, at 99 Hertz, for 10 seconds:
perf record -F 99 -p PID sleep 10
I have a doubt about it: wouldn’t perf sample two processes, one with specified PID and the other is sleep task? Yes, I know sleep should do nothing to affect sampling, but as someone who likes to find the root cause, I want to know whether the sleep will be sampled or not.
First of all, check the manual page, unfortunately, I couldn’t get the answer.
Secondly, experiment. I wrote a simple program which just prints something forever:
$ cat a.c
#include <stdio.h>
int main()
{
    while (1)
        printf("Hello\n");
}
Compile and use perf record to profile it for a while:
$ gcc a.c
$ sudo perf record ./a.out
Hello
Hello
.....;
^C[ perf record: Woken up 1 times to write data ]
[ perf record: Captured and wrote 0.106 MB perf.data (2409 samples) ]
Check the perf.data:
Samples: 2K of event 'cycles:ppp', Event count (approx.): 853929764
Overhead  Command  Shared Object      Symbol
   9.66%  a.out    [kernel.kallsyms]  [k] retint_userspace_restore_args
   7.69%  a.out    [kernel.kallsyms]  [k] _raw_spin_lock_irqsave
   4.29%  a.out    [kernel.kallsyms]  [k] n_tty_write
   3.75%  a.out    [kernel.kallsyms]  [k] system_call_after_swapgs
   3.63%  a.out    [kernel.kallsyms]  [k] irq_return
   3.01%  a.out    [kernel.kallsyms]  [k] native_write_msr_safe
......
Nothing special, just to make sure that a.out process can be profiled. Launch htop program whose PID is 39741, then execute following command for several seconds:
$ sudo perf record -p 39741 ./a.out
Hello
Hello
......
^CHello
[ perf record: Woken up 1 times to write data ]
[ perf record: Captured and wrote 0.019 MB perf.data (98 samples) ]
a.out ran smoothly, but from perf report:
Samples: 98  of event 'cycles:ppp', Event count (approx.): 77850922
Overhead  Command  Shared Object       Symbol
   1.02%  htop     [kernel.kallsyms]   [k] sys_read                                                  ▒
   1.02%  htop     [kernel.kallsyms]   [k] getname                                                   ▒
   1.02%  htop     [kernel.kallsyms]   [k] __d_lookup_rcu                                            ▒
   1.02%  htop     [kernel.kallsyms]   [k] generic_permission                                        ▒
   1.02%  htop     [kernel.kallsyms]   [k] do_task_stat
......
I couldn’t see any samples from a.out, and all are from htop. So it seems a.out won’t be profiled in this scenario.
Third, check perf source code to verify my speculation. Roughly speaking, “perf record [options] command [options]” will fork a child process to run command, and it is in evlist__prepare_workload:
int evlist__prepare_workload(struct evlist *evlist, struct target *target, const char *argv[],
                 bool pipe_output, void (*exec_error)(int signo, siginfo_t *info, void *ucontext))
{
    ......
    if (target__none(target)) {
        if (evlist->core.threads == NULL) {
            fprintf(stderr, "FATAL: evlist->threads need to be set at this point (%s:%d).\n",
                __func__, __LINE__);
            goto out_close_pipes;
        }
        perf_thread_map__set_pid(evlist->core.threads, 0, evlist->workload.pid);
    }
    ......
}
For target__none:
static inline bool target__none(struct target *target)
{
    return !target__has_task(target) && !target__has_cpu(target);
}
Because I have already set interested process by pid before, target__has_task(target) will return true, which will cause target__none() returns false, therefore perf_thread_map__set_pid won’t be invoked and the forked process isn’t added into evlist->core.threads. That’s the reason why the command process won’t be profiled. Similarly, if target__has_cpu(target) returns true, the command process is not tracked either.
In summary, to find answer of doubt: read code, write code to verify, repeat, that’s all.