Yesterday I met a performance issue: the consumer threads’ CPU utilisation are nearly 100%. From the perf report, these consumer threads spent remarkable time in searching from the hash tables. Since every consumer thread has its own hash table, we don’t need to worry about lock-contention issue, but the buckets number of the hash table is not large enough, so every bucket holds too many elements, and searching from these elements costs a lot of time. The fix is straightforward: increase the number of buckets.
Tag: performance
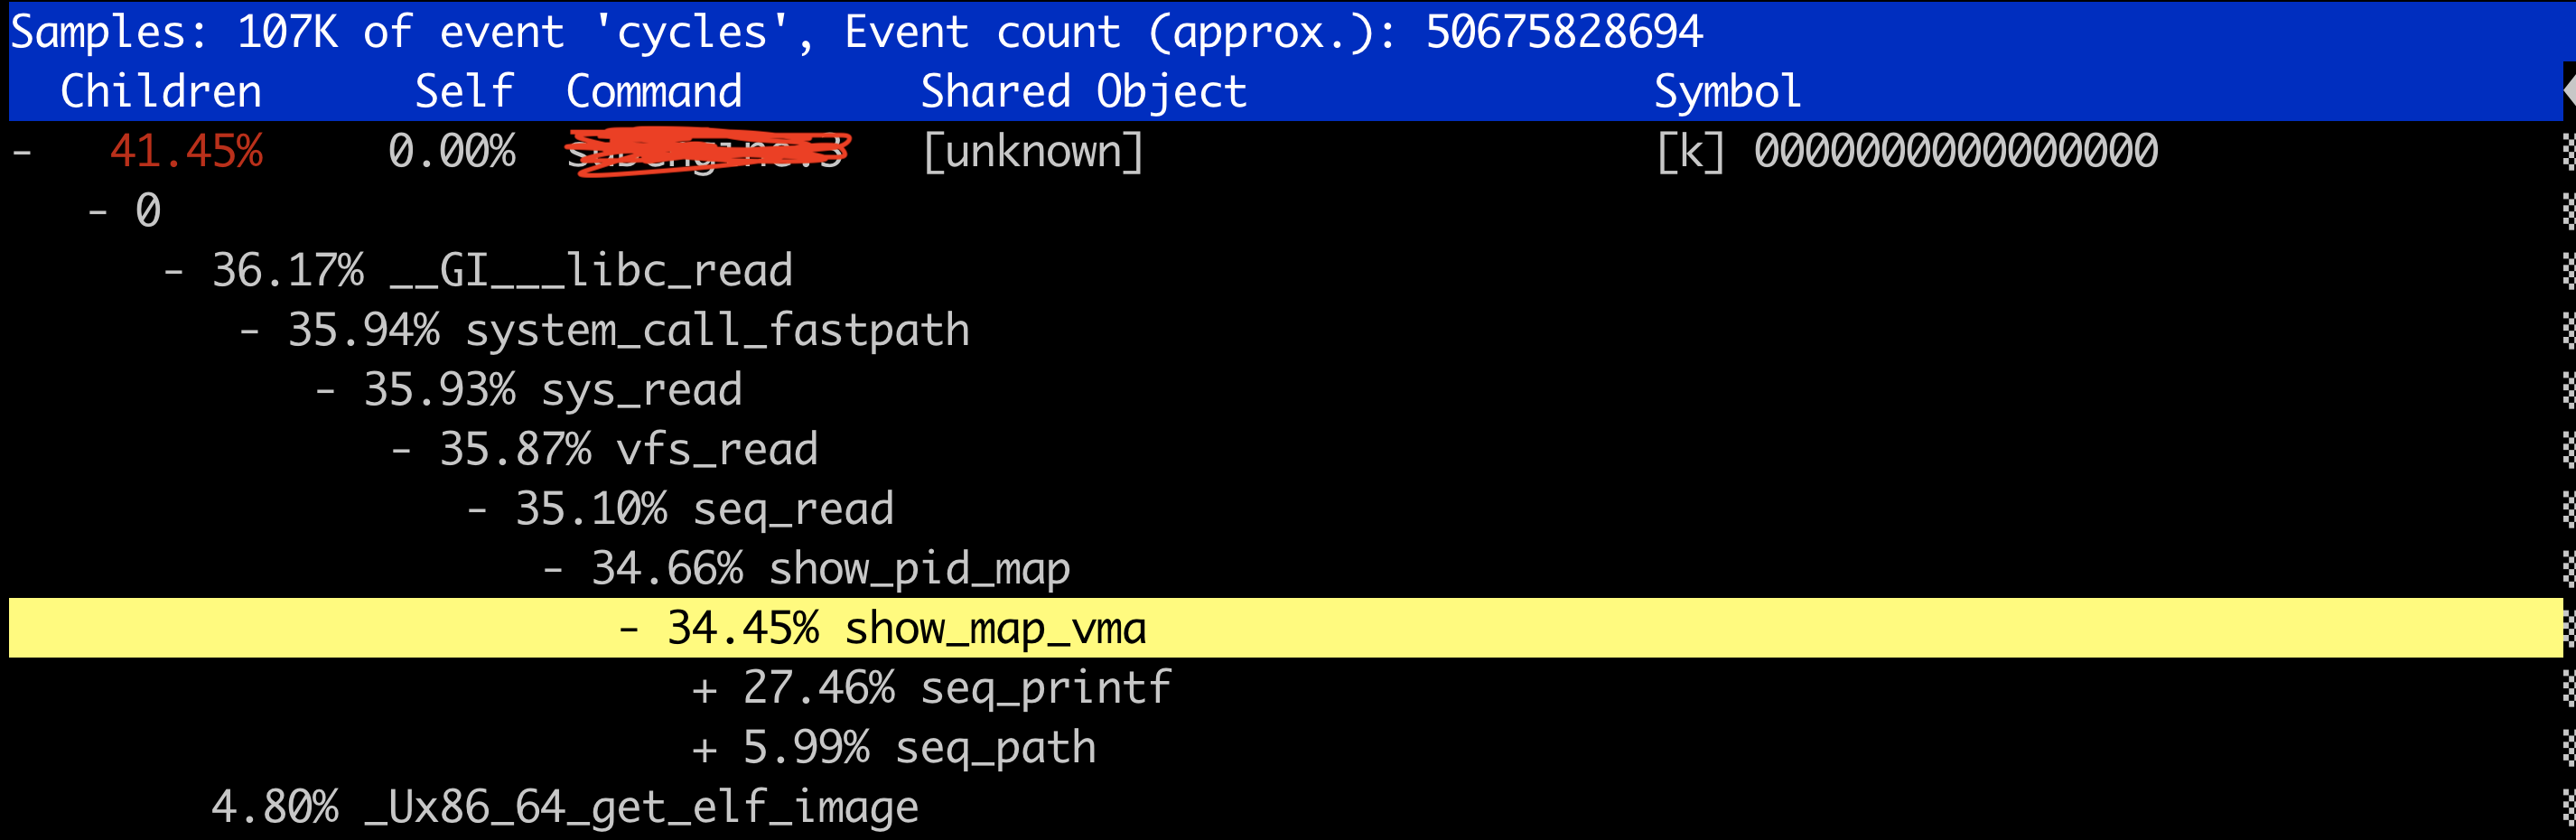
unw_get_proc_name() can be a performance bottleneck
Use “LC_ALL=C” to improve performance
Using “LC_ALL=C” can improve some program’s performance. The following is the test without LC_ALL=C of join program:
$ locale
LANG=en_US.UTF-8
LC_CTYPE="en_US.UTF-8"
LC_NUMERIC="en_US.UTF-8"
LC_TIME="en_US.UTF-8"
LC_COLLATE="en_US.UTF-8"
LC_MONETARY="en_US.UTF-8"
LC_MESSAGES="en_US.UTF-8"
LC_PAPER="en_US.UTF-8"
LC_NAME="en_US.UTF-8"
LC_ADDRESS="en_US.UTF-8"
LC_TELEPHONE="en_US.UTF-8"
LC_MEASUREMENT="en_US.UTF-8"
LC_IDENTIFICATION="en_US.UTF-8"
LC_ALL=
$ sudo sh -c "sync; echo 3 > /proc/sys/vm/drop_caches"
$ time join 1.sorted 2.sorted > 1-2.sorted.aggregated

real    0m49.903s
user    0m48.427s
sys 0m0.786s
And this one is using “LC_ALL=C“:
$ sudo sh -c "sync; echo 3 > /proc/sys/vm/drop_caches"
$ time LC_ALL=C join 1.sorted 2.sorted > 1-2.sorted.aggregated

real    0m12.752s
user    0m5.628s
sys 0m0.971s
some good references about this topic are Speed up grep searches with LC_ALL=C and Everyone knows grep is faster in the C locale.
Clear file system cache before doing I/O-intensive benchmark on Linux
If you do any I/O-intensive benchmark, please run following command before it (Otherwise you may get wrong impression of the program performance):
$ sudo sh -c "sync; echo 3 > /proc/sys/vm/drop_caches"
sync means writing data from cache to file system (otherwise the dirty cache can’t be freed); “echo 3 > /proc/sys/vm/drop_caches” will drop clean caches, as well as reclaimable slab objects. Check following command:
$ sudo sh -c "sync; echo 3 > /proc/sys/vm/drop_caches"
$ time ./benchmark

real    0m12.434s
user    0m5.633s
sys 0m0.761s
$ time ./benchmark

real    0m6.291s
user    0m5.645s
sys 0m0.631s
the first run time of benchmark program is ~12 seconds. Now that the files are cached, the second run time of benchmark program is halved: ~6 seconds.
References:
Why drop caches in Linux?;
/proc/sys/vm;
CLEAR_CACHES.
Rewrite a python program using C to boost performance
Recently I converted a python program to C. The python program will run for about 1 hour to finish the task:
$ /usr/bin/time -v taskset -c 35 python_program ....
......
        User time (seconds): 3553.48
        System time (seconds): 97.70
        Percent of CPU this job got: 99%
        Elapsed (wall clock) time (h:mm:ss or m:ss): 1:00:51
        Average shared text size (kbytes): 0
        Average unshared data size (kbytes): 0
        Average stack size (kbytes): 0
        Average total size (kbytes): 0
        Maximum resident set size (kbytes): 12048772
        Average resident set size (kbytes): 0
        Major (requiring I/O) page faults: 0
        Minor (reclaiming a frame) page faults: 11434463
        Voluntary context switches: 58873
        Involuntary context switches: 21529
        Swaps: 0
        File system inputs: 1918744
        File system outputs: 4704
        Socket messages sent: 0
        Socket messages received: 0
        Signals delivered: 0
        Page size (bytes): 4096
        Exit status: 0
while the C program only needs about 5 minutes:
$ /usr/bin/time -v taskset -c 35 c_program ....
......
        User time (seconds): 282.45
        System time (seconds): 8.66
        Percent of CPU this job got: 99%
        Elapsed (wall clock) time (h:mm:ss or m:ss): 4:51.17
        Average shared text size (kbytes): 0
        Average unshared data size (kbytes): 0
        Average stack size (kbytes): 0
        Average total size (kbytes): 0
        Maximum resident set size (kbytes): 16430216
        Average resident set size (kbytes): 0
        Major (requiring I/O) page faults: 0
        Minor (reclaiming a frame) page faults: 3962437
        Voluntary context switches: 14
        Involuntary context switches: 388
        Swaps: 0
        File system inputs: 1918744
        File system outputs: 4960
        Socket messages sent: 0
        Socket messages received: 0
        Signals delivered: 0
        Page size (bytes): 4096
        Exit status: 0
From the /usr/bin/time‘s output, we can see python program uses less memory than C program, but suffers more “page faults” and “context switches”.