In most Linux environments, the perf tools should be set up by default. Otherwise, you can install it manually. E.g., in ArchLinux:
# pacman -S perf
Use following program as an example (It is a rifacimento from here, and you should only focus on the framework of the code):
# cat test.cpp
#include <NTL/ZZX.h>

using namespace std;
using namespace NTL;

void inner(int i, ZZX& t, Vec<ZZX>& phi)
{
        for (long j = 1; j <= i-1; j++)
         if (i % j == 0)
            t *= phi(j);
}

void outer(int i, Vec<ZZX>& phi)
{
        ZZX t;
        t = 1;
        inner(i, t, phi);
        phi(i) = (ZZX(INIT_MONO, i) - 1)/t;
        cout << phi(i) << "\n";
}

int main()
{
   Vec<ZZX> phi(INIT_SIZE, 100);

   for (long i = 1; i <= phi.length(); i++) {
      outer(i, phi);
   }
}
Compile it:
# g++ -g -O2 -pthread test.cpp -lntl -lgmp
It is suggested that using -g -O2 options since -g can provide debug information which perf needs and -O2 can generate lots of optimizations.
Use perf record to sample the program:
# perf record --call-graph dwarf ./a.out
......
[ perf record: Woken up 2 times to write data ]
[ perf record: Captured and wrote 0.318 MB perf.data (38 samples) ]
To profile an already running program, use -p pid flag. A perf.data file will be generated in current directory, and you can use perf report command to parse it:
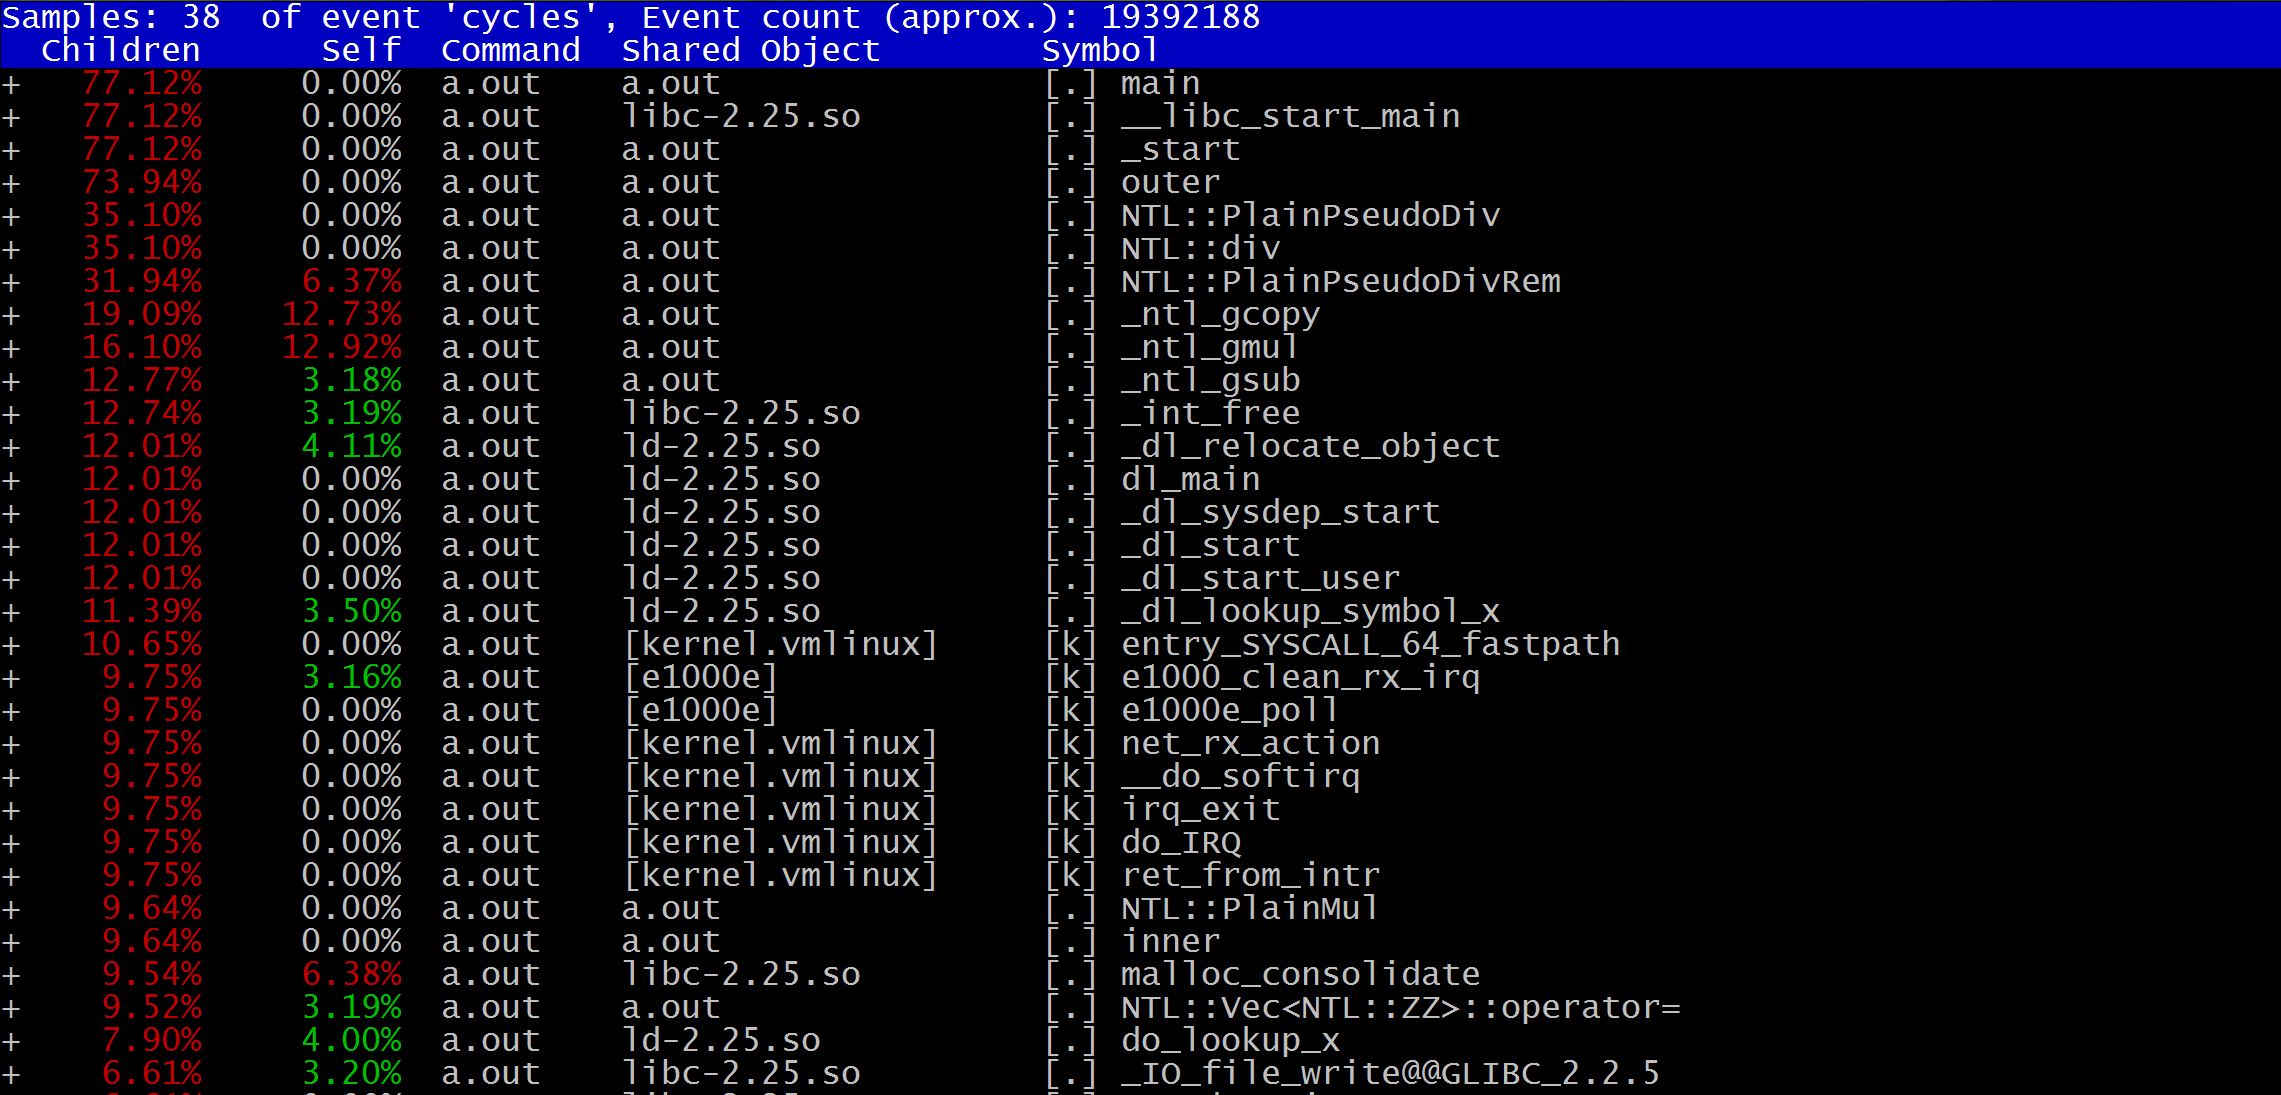
# perf report
The detailed information of every function will be showed:
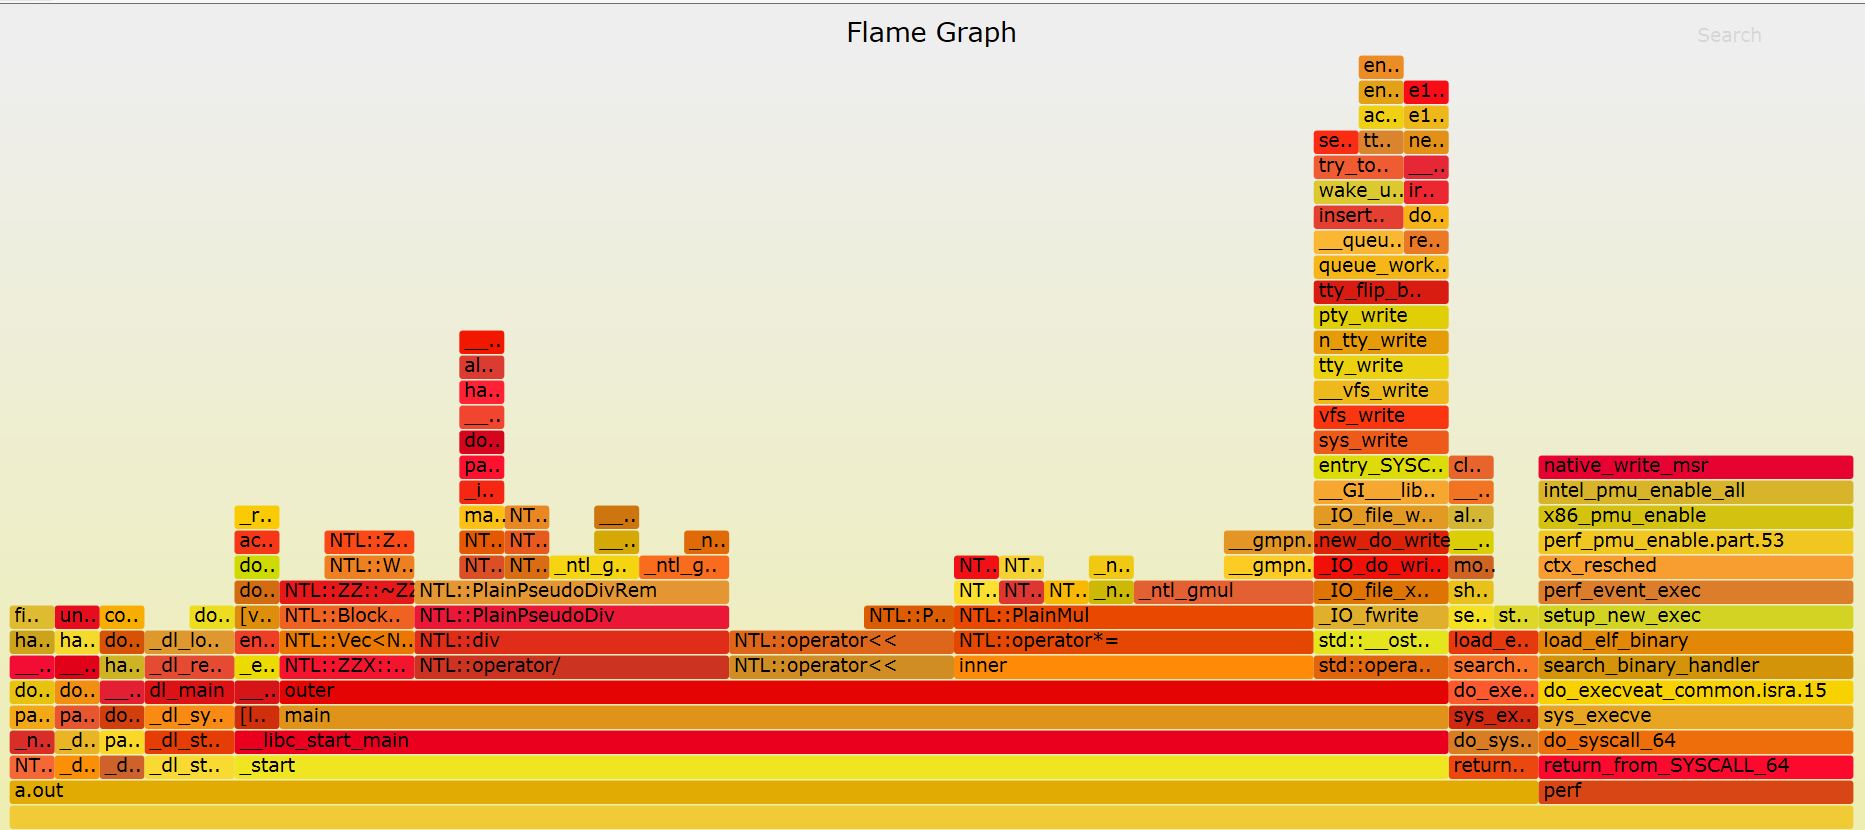
Another awesome tool is FlameGraph which is used to analyze stack call traces:
# git clone --depth 1 https://github.com/brendangregg/FlameGraph
# cd FlameGraph
Copy perf.data into current directory:
# cp ../perf.data ./
Execute following command:
# perf script | ./stackcollapse-perf.pl |./flamegraph.pl > perf.svg
The perf.svg is like this:
You can see the whole stack frameworks and functions’ consume time ratio.
P.S., the full code is here.


Thanks for the post. I have a question, can we profile multiple pids (not system-wide profiling using -a) using perf.
Maybe https://stackoverflow.com/questions/44097464/linux-perf-tools-how-to-simultaniously-profiling-multiple-processes-how-to-ex can help you.