A program on CentOS 7 can’t find libubsan.so.1:
    $ ldd .local/debug/main
    .....
    libubsan.so.1 => not found
The correct method is to install libubsan1 instead of libubsan.
A program on CentOS 7 can’t find libubsan.so.1:
$ ldd .local/debug/main
.....
libubsan.so.1 => not found
The correct method is to install libubsan1 instead of libubsan.
I use NetworkManager to manage network on Arch Linux:
# systemctl --type=service
  UNIT                               LOAD   ACTIVE SUB     DESCRIPTION                               >
  dbus.service                       loaded active running D-Bus System Message Bus                  >
  getty@tty1.service                 loaded active running Getty on tty1                             >
  kmod-static-nodes.service          loaded active exited  Create list of static device nodes for the>
  NetworkManager.service             loaded active running Network Manager
......
So I will leverage nmcli to configure static IP address:
(1) Check current connection:
# nmcli con show
NAME                UUID                                  TYPE      DEVICE
Wired connection 1  f1014ad6-4291-3c29-9b0d-b552a0c5eb02  ethernet  enp0s3
(2) Configure IP address, gateway and DNS:
# nmcli con modify f1014ad6-4291-3c29-9b0d-b552a0c5eb02 ipv4.addresses 192.168.1.124/24
# nmcli con modify f1014ad6-4291-3c29-9b0d-b552a0c5eb02 ipv4.gateway 192.168.1.1
# nmcli con modify f1014ad6-4291-3c29-9b0d-b552a0c5eb02 ipv4.dns "8.8.8.8"
# nmcli con modify f1014ad6-4291-3c29-9b0d-b552a0c5eb02 ipv4.method manual
(3) Active connection:
# nmcli con up f1014ad6-4291-3c29-9b0d-b552a0c5eb02
It is done! BTW, the connection file can be found:
# cat /etc/NetworkManager/system-connections/Wired\ connection\ 1.nmconnection
[connection]
id=Wired connection 1
uuid=f1014ad6-4291-3c29-9b0d-b552a0c5eb02
type=ethernet
autoconnect-priority=-999
interface-name=enp0s3
......
Reference:
How to Configure Network Connection Using ‘nmcli’ Tool.
Check following simple program:
# cat foo.c
#include <inttypes.h>
#include <stdio.h>
#include <x86intrin.h>

int main(void) {
    printf("%" PRIu32 "\n", _mm_crc32_u32(42, 2534474250));
    return 0;
}
Use gcc to compile with no options:
# gcc foo.c
In file included from /usr/lib/gcc/x86_64-pc-linux-gnu/10.2.0/include/immintrin.h:37,
                 from /usr/lib/gcc/x86_64-pc-linux-gnu/10.2.0/include/x86intrin.h:32,
                 from foo.c:3:
foo.c: In function ‘main’:
/usr/lib/gcc/x86_64-pc-linux-gnu/10.2.0/include/smmintrin.h:839:1: error: inlining failed in call to ‘always_inline’ ‘_mm_crc32_u32’: target specific option mismatch
  839 | _mm_crc32_u32 (unsigned int __C, unsigned int __V)
      | ^~~~~~~~~~~~~
foo.c:6:2: note: called from here
    6 |  printf("%" PRIu32 "\n", _mm_crc32_u32(42, 2534474250));
      |  ^~~~~~~~~~~~~~~~~~~~~~~~~~~~~~~~~~~~~~~~~~~~~~~~~~~~~~
Should use -march=native option here:
# gcc -march=native foo.c
#
Reference:
stackoverflow.
On x86_64 platforms, some registers are “caller-saved” whilst others are “callee-saved” (refer AMD64 Calling Conventions for Linux / Mac OSX), or from Optimizing subroutines in assembly language, section 4.1, Register usage, “Registers that
can be used freely” (“caller-saved”) and “Registers that must be saved and restored” (“callee-saved”). When using gdb to display registers values, the values are relative to the selected stack frame (Refer Registers):
Normally, register values are relative to the selected stack frame (see Selecting a Frame). This means that you get the value that the register would contain if all stack frames farther in were exited and their saved registers restored. In order to see the true contents of hardware registers, you must select the innermost frame (with ‘frame 0’).
……
Also, the more “outer” the frame is you’re looking at, the more likely a call-clobbered register’s value is to be wrong, in the sense that it doesn’t actually represent the value the register had just before the call.
So it means when using gdb to analyse core dump file, you must pay attention to the registers values since it may not reflect correct values of current stack frame. Check following diagram:
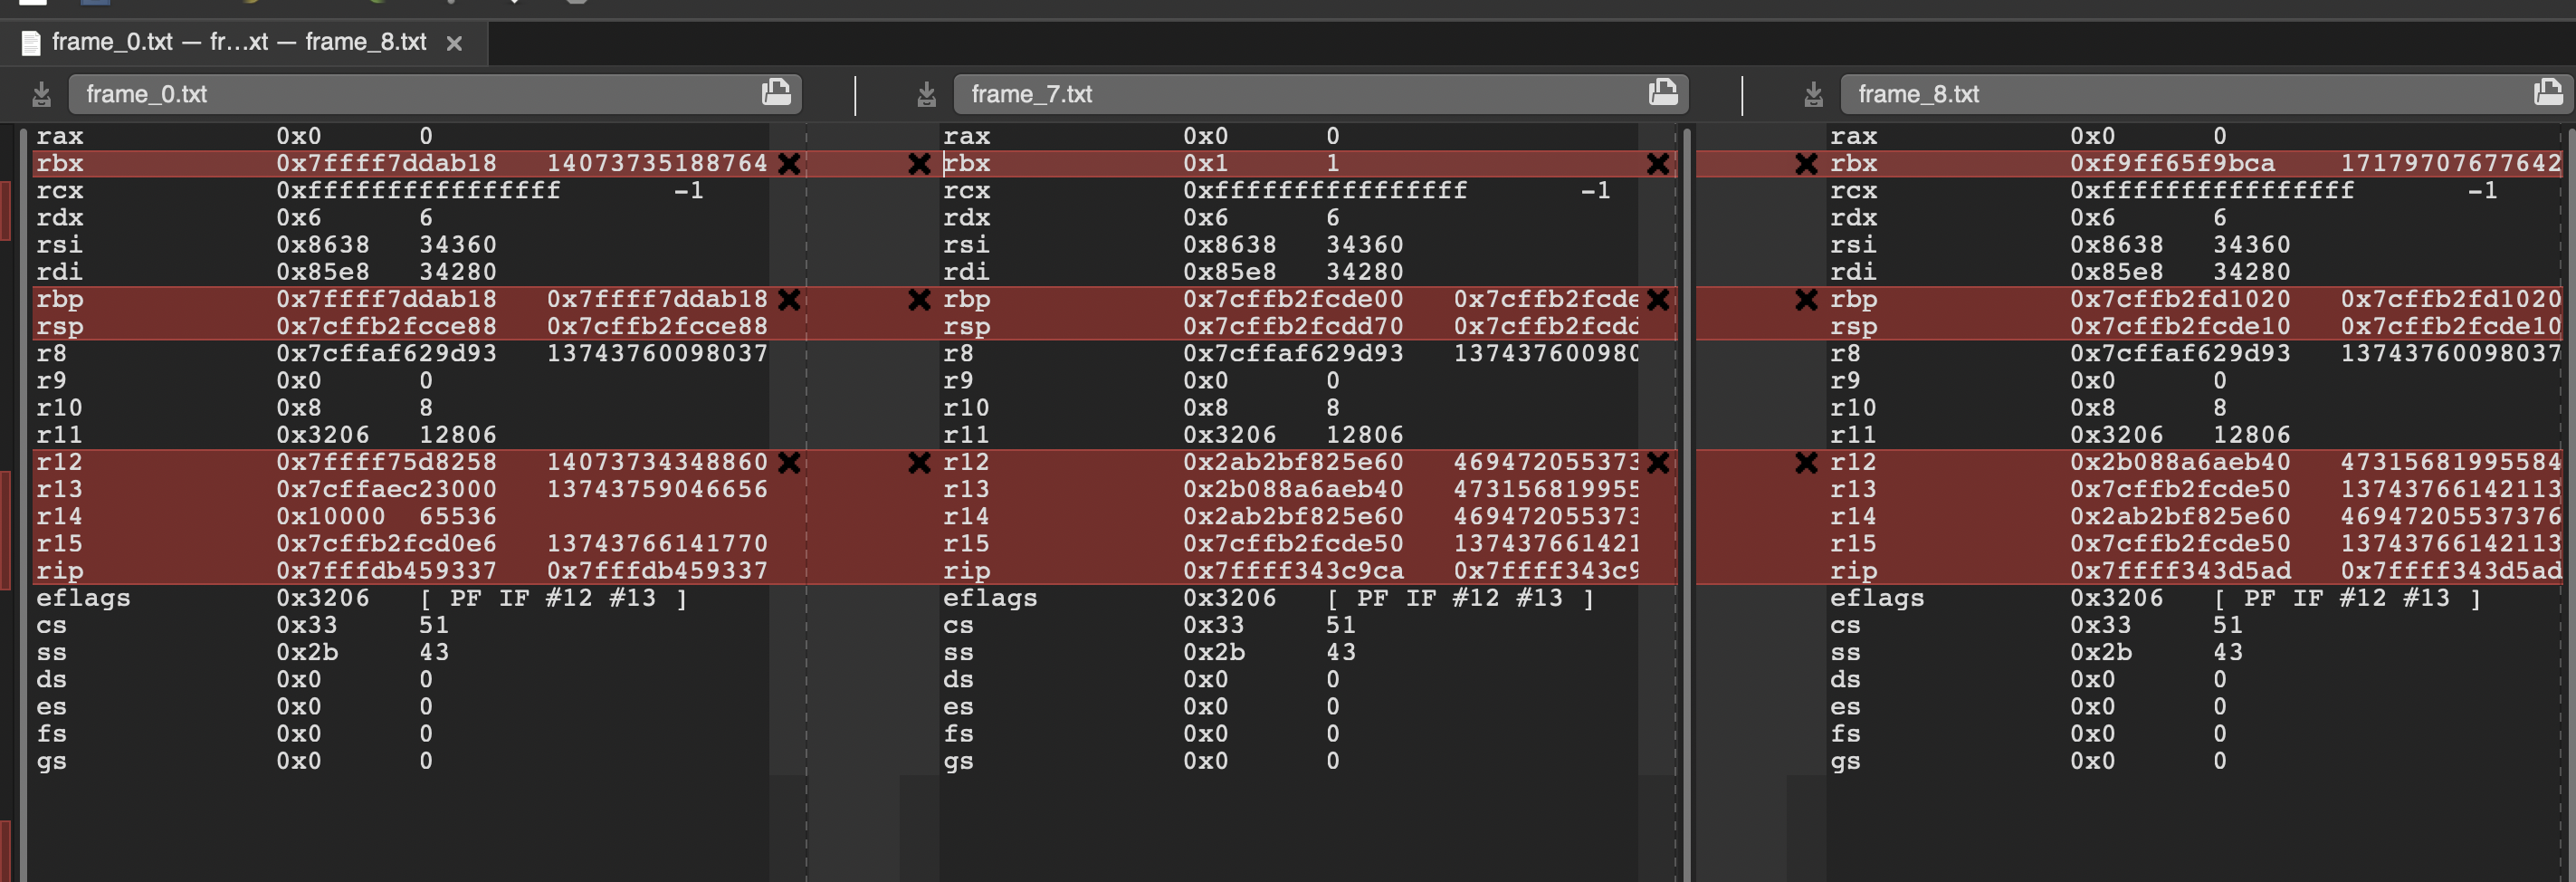
You can see only RSP, RIP and “callee-saved” registers are different among frame 0, 7 and 8.
Gcc‘s “-fstack-protector-strong” helped me catch an array overflow bug recently. The “-fstack-protector-strong” option will add “canary” in the function stack, when function returns, it would check whether the guard is corrupted or not. If corrupted, __stack_chk_fail() will be invoked:
    0x00007ffff5138674 <+52>:   mov    -0x38(%rbp),%rax
    0x00007ffff5138678 <+56>:   xor    %fs:0x28,%rax
    0x00007ffff5138681 <+65>:   jne    0x7ffff5138ff3 <function+2483>
    ......
    0x00007ffff5138ff3 <+2483>: callq  0x7ffff50c2100 <__stack_chk_fail@plt>
And the program will crash:
*** stack smashing detected ***: program terminated
Segmentation fault
Use gdb to check:
(gdb) bt
#0  0x00007fffde26e0b8 in ?? () from /usr/lib64/libgcc_s.so.1
#1  0x00007fffde26efb9 in _Unwind_Backtrace () from /usr/lib64/libgcc_s.so.1
#2  0x00007fffde890aa6 in backtrace () from /usr/lib64/libc.so.6
#3  0x00007fffde7f4ef4 in __libc_message () from /usr/lib64/libc.so.6
#4  0x00007fffde894577 in __fortify_fail () from /usr/lib64/libc.so.6
#5  0x00007fffde894532 in __stack_chk_fail () from /usr/lib64/libc.so.6
#6  0x00007ffff5138ff8 in function () at src.c:685
#7  0x045b9fd4c77e2ff3 in ?? ()
#8  0x9a8ad8e7e2eb8ca8 in ?? ()
#9  0x0fa0e627193655f1 in ?? ()
#10 0xfc295178098bb96f in ?? ()
#11 0xa09a574a7780cd13 in ?? ()
......
The function frames and return addresses are overwritten, so the call stack can’t be recovered. Please be aware that the line which gdb prints:
#6 0x00007ffff5138ff8 in function () at src.c:685
may not be related to culprit!