On x86_64 platforms, some registers are “caller-saved” whilst others are “callee-saved” (refer AMD64 Calling Conventions for Linux / Mac OSX), or from Optimizing subroutines in assembly language, section 4.1, Register usage, “Registers that
can be used freely” (“caller-saved”) and “Registers that must be saved and restored” (“callee-saved”). When using gdb to display registers values, the values are relative to the selected stack frame (Refer Registers):
Normally, register values are relative to the selected stack frame (see Selecting a Frame). This means that you get the value that the register would contain if all stack frames farther in were exited and their saved registers restored. In order to see the true contents of hardware registers, you must select the innermost frame (with ‘frame 0’).
……
Also, the more “outer” the frame is you’re looking at, the more likely a call-clobbered register’s value is to be wrong, in the sense that it doesn’t actually represent the value the register had just before the call.
So it means when using gdb to analyse core dump file, you must pay attention to the registers values since it may not reflect correct values of current stack frame. Check following diagram:
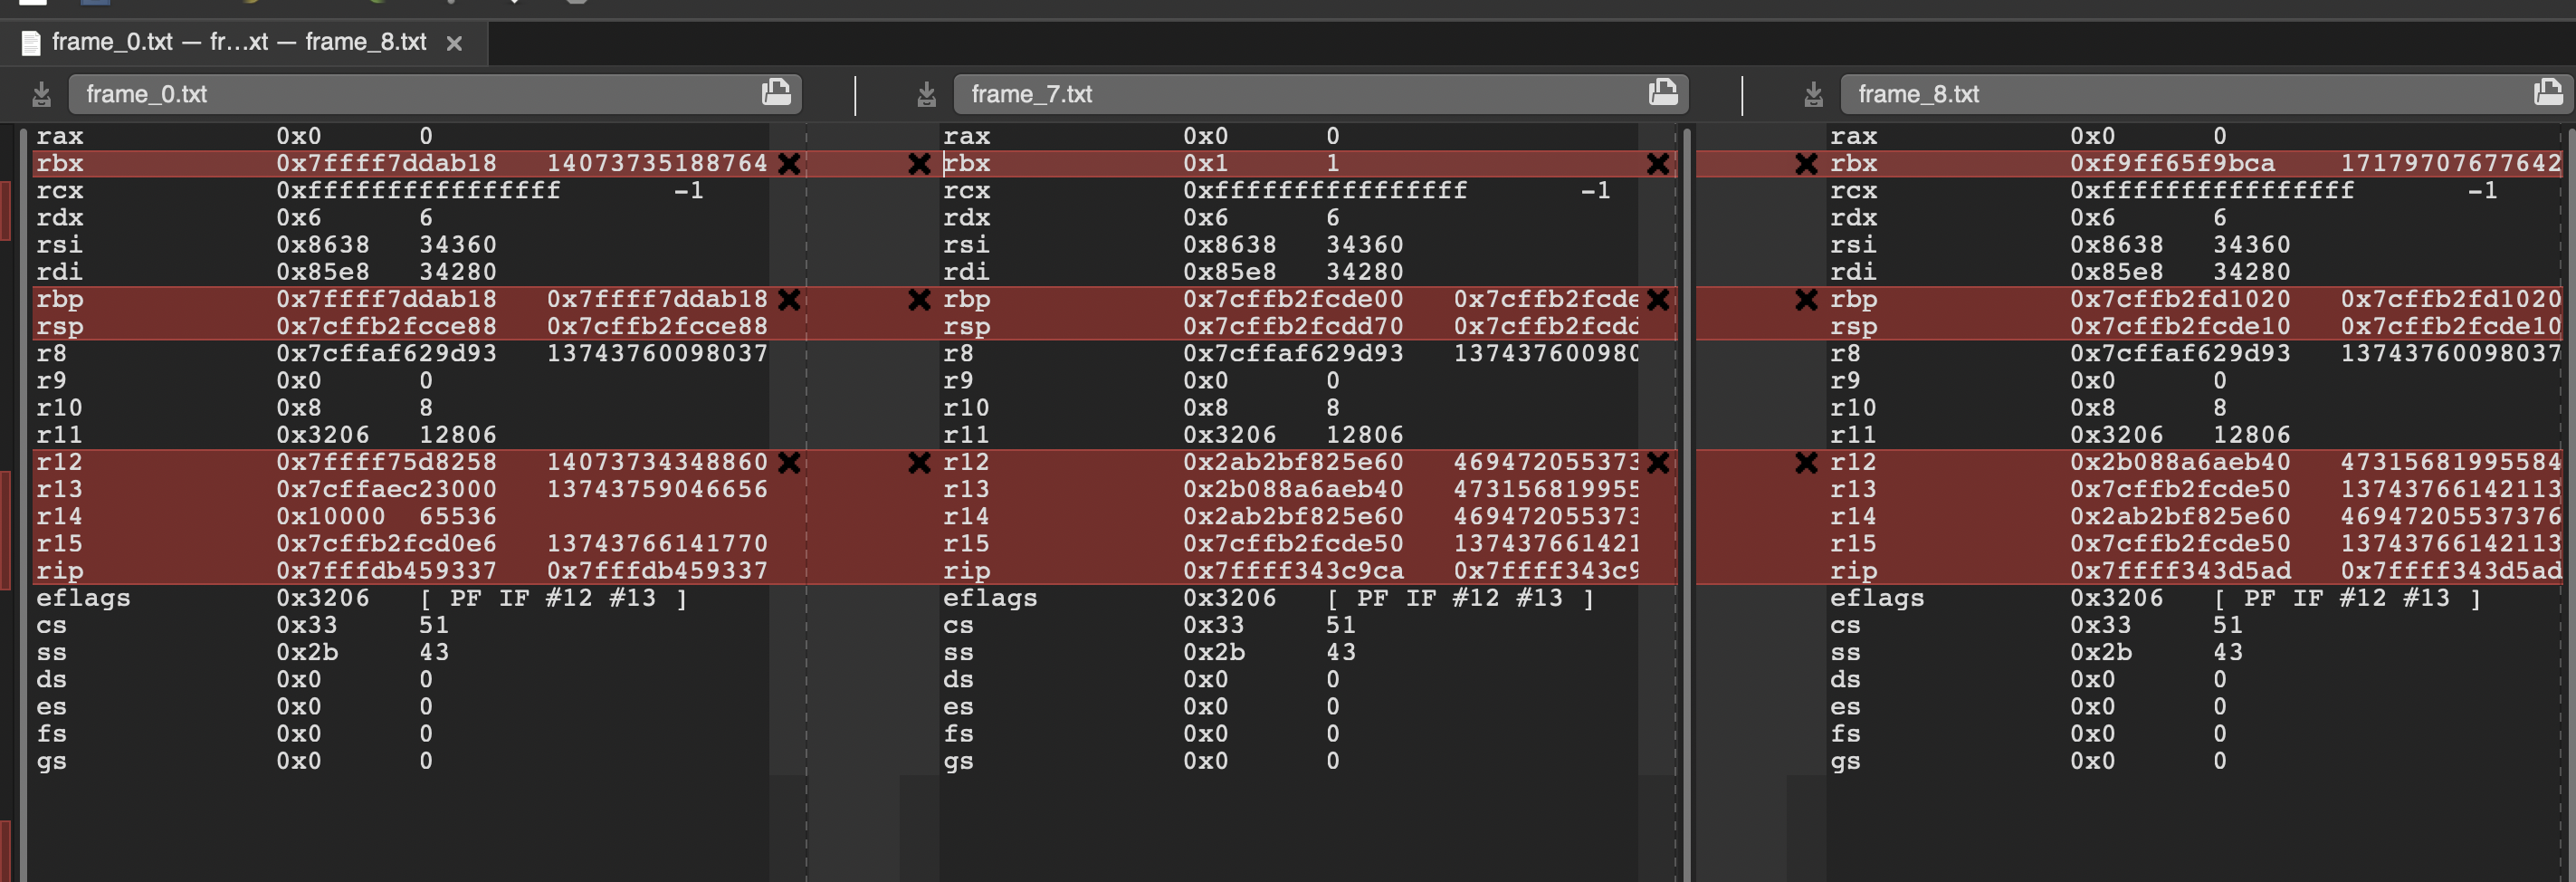
You can see only RSP, RIP and “callee-saved” registers are different among frame 0, 7 and 8.